
Alexander Lex
@alex-lex.bsky.social
720 followers
390 following
67 posts
Data visualization researcher. Associate Prof of CS at the University of Utah. Lab website: https://vdl.sci.utah.edu. Co-founder of
datavisyn: https://datavisyn.io
Posts
Media
Videos
Starter Packs


Alexander Lex
@alex-lex.bsky.social
· Aug 26
Alexander Lex
@alex-lex.bsky.social
· Aug 26


Reposted by Alexander Lex

Nils Kroemer
@nbkroemer.bsky.social
· Jul 2

Reposted by Alexander Lex

Reposted by Alexander Lex
Andrew McNutt
@mcnuttandrew.bsky.social
· Jun 10
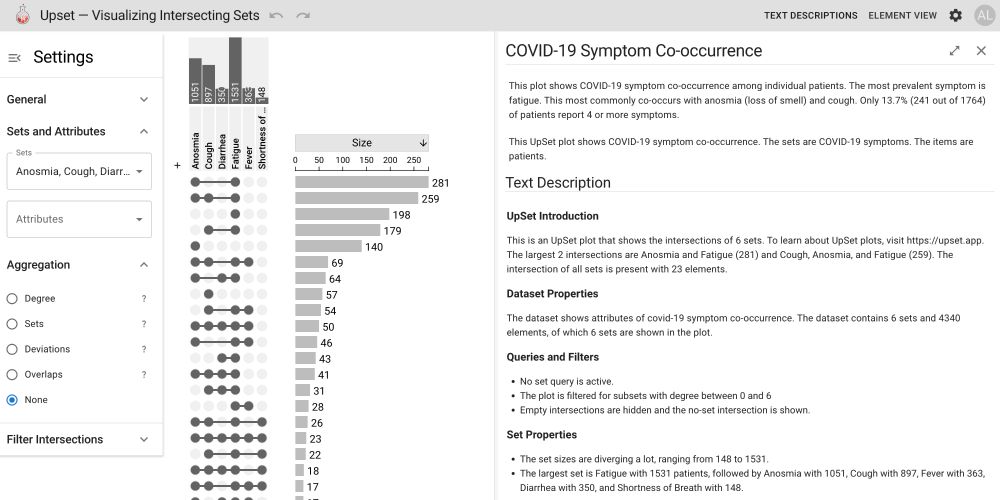
Making Data Visualizations Talk: Accessible Text Descriptions for UpSet Plots
Data visualizations in scientific journals are essential for understanding the content of an article. However, visualizations typically are inaccessible for blind or low-vision users. A common remedy ...
vdl.sci.utah.edu
Alexander Lex
@alex-lex.bsky.social
· Jun 4
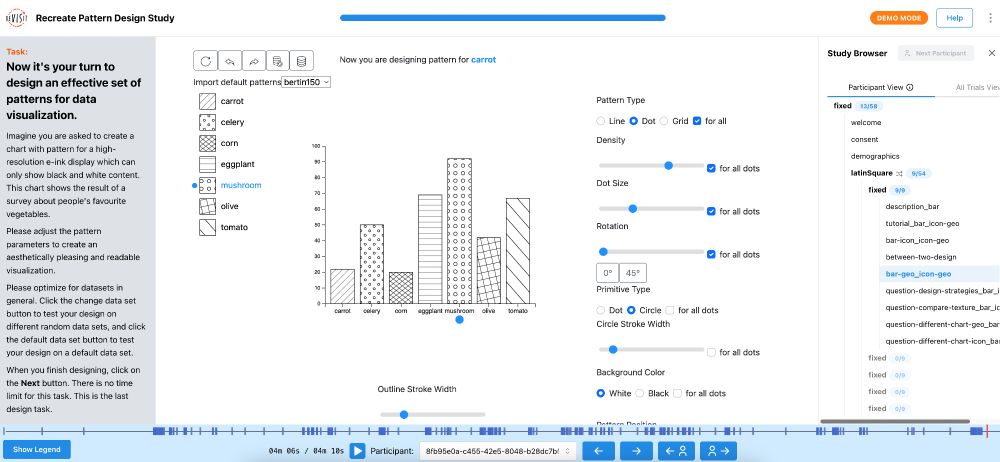
Running Online User Studies with the reVISit Framework
There currently are two main approaches for running online user studies: experimenters can use commercial survey tools, which are easy to use but can be costly, hamper reproducibility, and have limita...
diglib.eg.org
Reposted by Alexander Lex

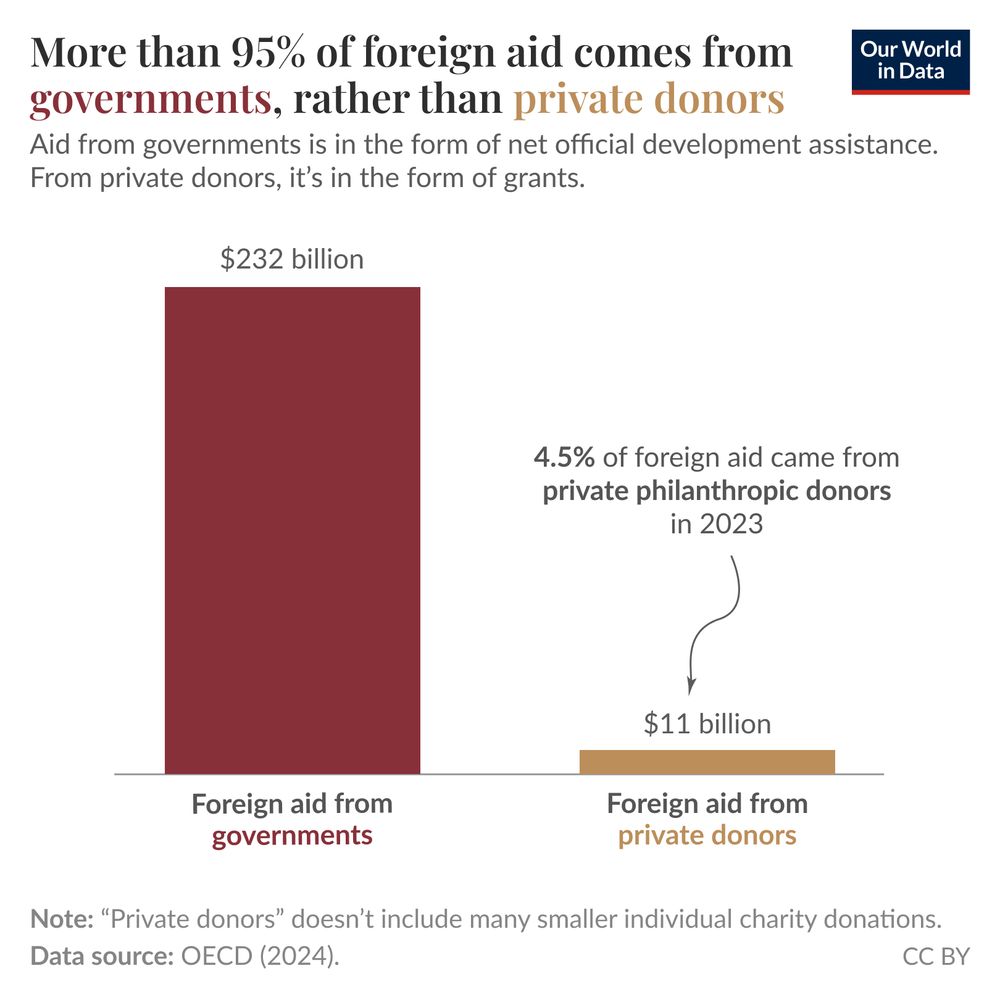
Robert Rohde
@rarohde.bsky.social
· May 9

Reposted by Alexander Lex

Matthew Kay
@mjskay.com
· Apr 23


Alexander Lex
@alex-lex.bsky.social
· Apr 11
Alexander Lex
@alex-lex.bsky.social
· Apr 9

Reading Between the Lines: The US Computer Science Graduate Admission Process
It’s the time of the year that prospective graduate students have to commit to a particular computer science graduate program. Those that got multiple offers are in the envious position to be able to ...
vdl.sci.utah.edu
Reposted by Alexander Lex

Reposted by Alexander Lex

jonathan zong
@jonathanzong.com
· Mar 31
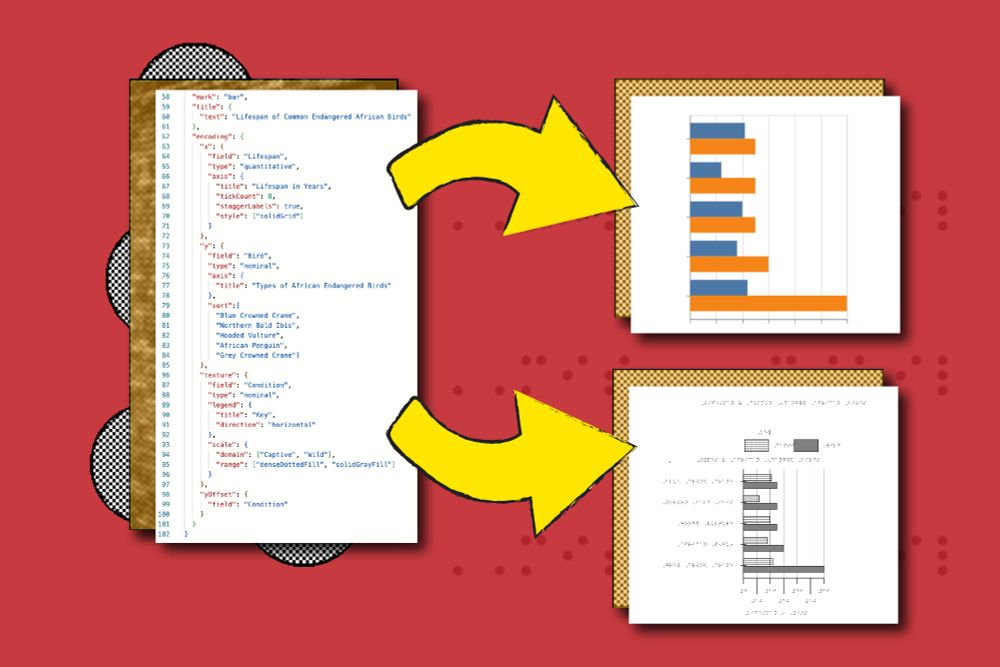
A new way to make graphs more accessible to blind and low-vision readers
Designed to help blind and low-vision readers understand graphics, the “Tactile Vega-Lite” system from MIT CSAIL converts data into a standard visual graph and a tactile chart. Accessibility standards...
news.mit.edu