Brian McNoldy
@bmcnoldy.bsky.social
13K followers 2.1K following 1.5K posts
Univ. of Miami hurricane researcher 🌀 living in New Mexico 🏜. Husband and dog dad. 🏳️‍🌈 https://bmcnoldy.earth.miami.edu/
Posts Media Videos Starter Packs
bmcnoldy.bsky.social
If we convert the specific humidity thresholds to dewpoint, here's a map showing the extent of summertime "mugginess", where the average dewpoint is 65°F+ (northern blue contour line). The southern blue contour line shows the region where the average summertime dewpoint is a soupy 72°F+.
bmcnoldy.bsky.social
I'm thrilled to share this paper that was just published today in Climatic Change on the effect of "seasonally muggy" conditions that exacerbate chronic heat and thermal discomfort in places like south Florida.

doi.org/10.1007/s105...

Lead author: @weatherkos.bsky.social
Nighttime land surface temperature and thermal discomfort in a seasonally muggy climate - Climatic Change
Globally, increasing air moisture can limit not only the human body’s ability to cool down, but also that of the Earth’s surface. This interaction, however, remains understudied—especially across subtropical-to-tropical regions that experience high levels of humidity. Here, we examine how air moisture influences nighttime land surface temperatures (LSTs), as well as what this interaction means for thermal comfort overnight. During summer months across seasonally muggy Southern Florida, during which time air moisture reaches the highest values of any place in the United States, we examine: 1) how air moisture, measured as specific humidity, varies with urbanicity and geography; 2) whether air moisture limits LST cooling at night; and 3) the implications of increased air moisture and nighttime LSTs for thermal comfort overnight. Based on data from 30 weather stations, we find that nighttime LST remains higher and closer to daytime highs in areas with increased specific humidity, highlighting a decreased surface cooling phenomenon in more humid areas. Both urban and coastal areas exhibit higher nighttime LSTs that are strongly related to thermal discomfort—also resulting in more time spent at or above critical thresholds for thermal discomfort overnight. This analysis therefore underscores the importance of heat mitigation and adaptation strategies that reduce LSTs and anthropogenic heat inputs in seasonally muggy climates in order to increase thermal comfort, especially near coastlines at lower latitudes.
doi.org
bmcnoldy.bsky.social
Well, here we are: the morning of October 8 is upon us... and it's a doozy.
bmcnoldy.bsky.social
3) another 7-8 inches is coming from persistent onshore winds generated by a stationary high pressure system near Bermuda

[2/2]
bmcnoldy.bsky.social
The significant ongoing tidal flooding event in the #Miami area is caused by a few coincident components:
1) the full moon on October 6, which happens to be near perigee (October 8)
2) sea level rise adds ~8 inches to the baseline sea level used in NOAA tide predictions

#KingTide
[1/2]
bmcnoldy.bsky.social
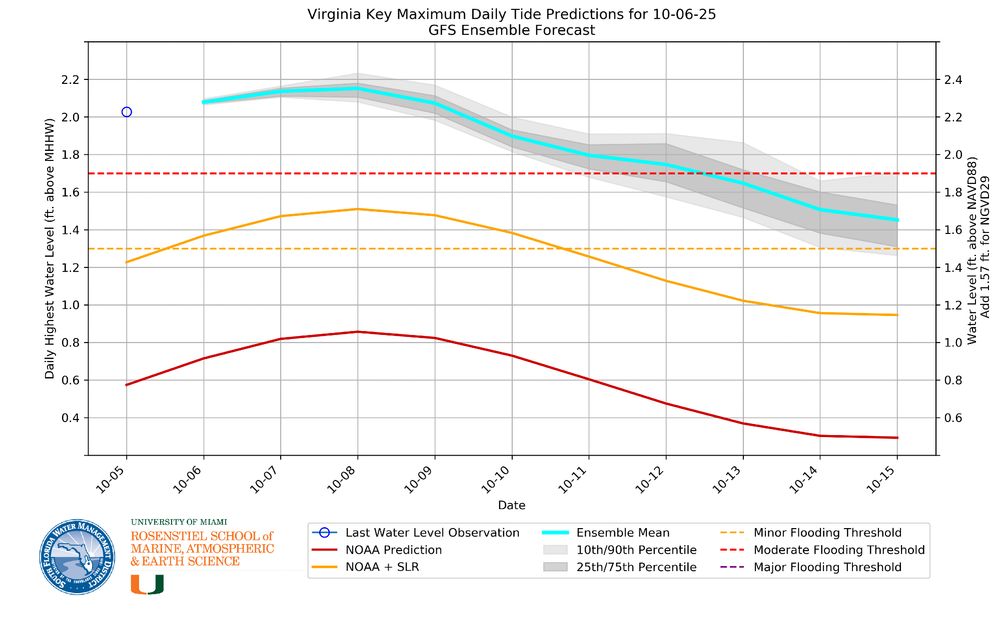
Additionally, water levels have peaked above the moderate flooding threshold since Saturday morning and are forecast to continue into the weekend.
bmcnoldy.earth.miami.edu/tide/
[2/2]
Enhanced NOAA Tide Predictions
Ten-day tide forecasts for South Florida Tide Gauge Locations.
bmcnoldy.earth.miami.edu
bmcnoldy.bsky.social
Peak water levels in the #Miami area have been above the minor flooding threshold for the past four days, and our tide forecasts show that continuing for at least the next ten days! #KingTide
bmcnoldy.earth.miami.edu/tide/
[1/2]
bmcnoldy.bsky.social
Yikes... wait 'til you see it in another 5-7 days then!
bmcnoldy.bsky.social
Now that Imelda is an extratropical cyclone and there's a break in the activity, here's a look back at the tracks of all 9 named storms so far this season. Their peak intensity, minimum pressure, and total Accumulated Cyclone Energy are listed on the right.
bmcnoldy.bsky.social
The highest predicted tide of the year is coming up on October 8, but on top of that, forecast conditions in the atmosphere and ocean will boost it even more.

Southeast Florida: Expect several days of minor to moderate tidal flooding around every high tide beginning this week.
bmcnoldy.bsky.social
Hurricane #Imelda made a direct landfall on #Bermuda late Wednesday night at Category 2 intensity.
bmcnoldy.earth.miami.edu/tropics/radar/
bmcnoldy.bsky.social
As fellow binary interaction enthusiast, you might enjoy this, @michaelrlowry.bsky.social!
Reposted by Brian McNoldy
michaelrlowry.bsky.social
How about *only* hurricane pairings in the Atlantic and for the entire period of record (since 1851). What are the closest two hurricanes have ever been recorded? Humberto and Imelda right at the top. The nearest reliable contender was Easy and Fox back in 1951.
bmcnoldy.bsky.social
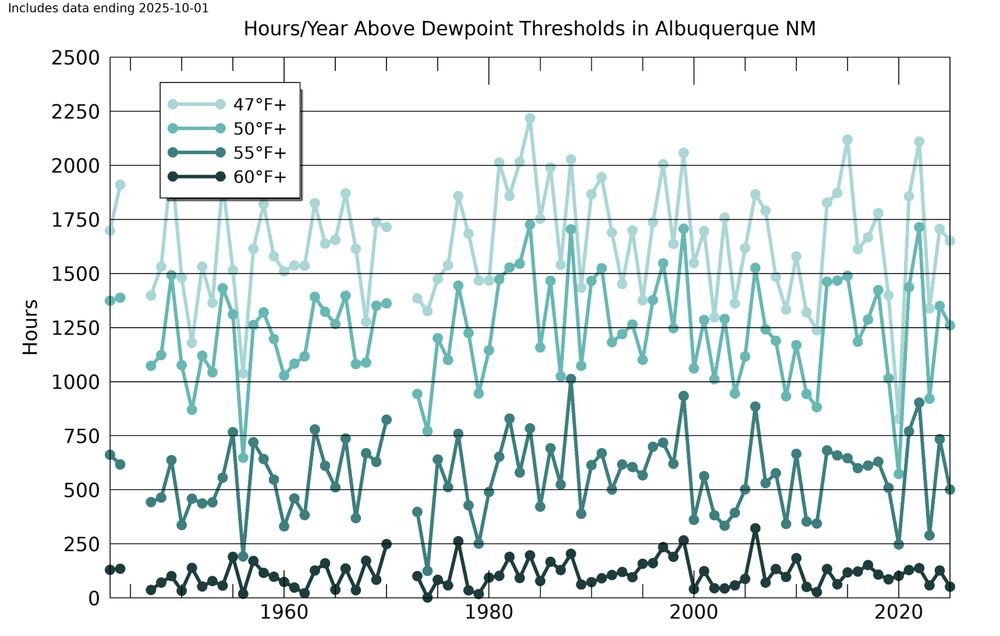
For reference, the exact values for each of the thresholds in 2025 (so far) are included below, with the annual number of hours averaged over the 1991-2020 "climate normal" period shown in parentheses.

≥47°F: 1651 (1620)
≥50°F: 1260 (1222)
≥55°F: 501 (558)
≥60°F: 52 (120)

[2/2]
Albuquerque HeatIndex/WindChill Climatology
Daily and monthly climatological data from the NWS weather station at Albuquerque International Airport, NM
bmcnoldy.earth.miami.edu
bmcnoldy.bsky.social
Now that #monsoon season is officially over in the #Albuquerque area and dewpoints are generally on the decline, here's a look at the amount of time spent above a few dewpoint (humidity) thresholds.

[1/2]
bmcnoldy.bsky.social
I first shared this last October, and was really surprised at the feedback... it turns out far more people than you'd think have similar stories. Even if you aren't one of them, I guarantee you know several people.
drive.google.com/file/d/1CVSw...
Reflecting on Four Decades of Unexplained Activities.pdf
drive.google.com
bmcnoldy.bsky.social
Definitely relevant for #Imelda now!
bmcnoldy.bsky.social
I started this radar loop from #Bermuda early for #Imelda, but in the meantime, it's capturing some hefty rainbands from #Humberto! Latest loop is available at bmcnoldy.earth.miami.edu/tropics/radar/
bmcnoldy.bsky.social
and many others that lit up October in recent memory... Mitch '98, Joaquin '15, Matthew '16, Michael '18, Eta '20, Iota '20, Milton '24, etc, etc
bmcnoldy.bsky.social
The tropical Atlantic has now had 15 consecutive days of activity, and it's not over yet (Imelda will be around for another day or so). The Accumulated Cyclone Energy (ACE) climbed from 53% of average for the date to the current 93%. Climatologically, 20% of a season's ACE occurs after October 1.
bmcnoldy.bsky.social
The general rule of thumb is ~800 miles for an elastic interaction, but there's no hard number because of differences in size and intensity.
bmcnoldy.bsky.social
This interaction reminded me of Typhoons Della and Faye (1960) in the West Pacific as shown in Figure 3 of Dong and Neumann (1983): "On the Relative Motion of Binary Tropical Cyclones".
Humberto and Imelda got much closer together than Della and Faye did.
journals.ametsoc.org/view/journal...
[4/4]
bmcnoldy.bsky.social
This style of plot is what we used to document the interaction and merger of Gil and Henriette in the East Pacific (2001) in a paper I co-authored, Prieto et al (2003): "A Classification of Binary Tropical Cyclone–Like Vortex Interactions". journals.ametsoc.org/downloadpdf/...
[3/4]
bmcnoldy.bsky.social
On that figure, Humberto's track is in red and Imelda's track is in blue, with ∘ and x marks every six hours. Their geographic centroid is shown in a green dashed line, and faint red and blue lines connect the storm tracks to the centroid. A centroid-relative plot is shown in the inset.
[2/4]