


Castory Munishi
@castory.bsky.social
Passionate about health data
Reposted by Castory Munishi
“I’ve taken several R trainings - this is the BEST!”
📢 New courses posted! Intro to R for public health
🗓️ 40 hours part-time, synchronous, with unlimited 1-on-1 coaching and options for ALL time zones.
✏️ Register: appliedepi.org/training/pub...
📢 New courses posted! Intro to R for public health
🗓️ 40 hours part-time, synchronous, with unlimited 1-on-1 coaching and options for ALL time zones.
✏️ Register: appliedepi.org/training/pub...

March 13, 2025 at 9:52 AM
“I’ve taken several R trainings - this is the BEST!”
📢 New courses posted! Intro to R for public health
🗓️ 40 hours part-time, synchronous, with unlimited 1-on-1 coaching and options for ALL time zones.
✏️ Register: appliedepi.org/training/pub...
📢 New courses posted! Intro to R for public health
🗓️ 40 hours part-time, synchronous, with unlimited 1-on-1 coaching and options for ALL time zones.
✏️ Register: appliedepi.org/training/pub...
Reposted by Castory Munishi
📢 Last week to apply for the Applied Epi scholarships!
Transition your team to R with free or discounted courses and services.
Why apply?
✔️ Full or partial scholarships
✔️ Focused on strengthening public health capacity
🗓️ Apply by Feb 10, 2025! 🌐 appliedepi.org/training/scholarships-ae
Transition your team to R with free or discounted courses and services.
Why apply?
✔️ Full or partial scholarships
✔️ Focused on strengthening public health capacity
🗓️ Apply by Feb 10, 2025! 🌐 appliedepi.org/training/scholarships-ae

February 3, 2025 at 8:51 PM
📢 Last week to apply for the Applied Epi scholarships!
Transition your team to R with free or discounted courses and services.
Why apply?
✔️ Full or partial scholarships
✔️ Focused on strengthening public health capacity
🗓️ Apply by Feb 10, 2025! 🌐 appliedepi.org/training/scholarships-ae
Transition your team to R with free or discounted courses and services.
Why apply?
✔️ Full or partial scholarships
✔️ Focused on strengthening public health capacity
🗓️ Apply by Feb 10, 2025! 🌐 appliedepi.org/training/scholarships-ae
Reposted by Castory Munishi
🎉 R scholarship applications open on January 20!
If your team (government or nonprofit) works in applied epidemiology in a low- or middle-income country, you could get access to our Intro to R course and Support Desk! Details: appliedepi.org/training/sch...
#Rstats #epitwitter
If your team (government or nonprofit) works in applied epidemiology in a low- or middle-income country, you could get access to our Intro to R course and Support Desk! Details: appliedepi.org/training/sch...
#Rstats #epitwitter

January 17, 2025 at 5:04 PM
🎉 R scholarship applications open on January 20!
If your team (government or nonprofit) works in applied epidemiology in a low- or middle-income country, you could get access to our Intro to R course and Support Desk! Details: appliedepi.org/training/sch...
#Rstats #epitwitter
If your team (government or nonprofit) works in applied epidemiology in a low- or middle-income country, you could get access to our Intro to R course and Support Desk! Details: appliedepi.org/training/sch...
#Rstats #epitwitter
Reposted by Castory Munishi
#NetZero is not enough: ratcheting ambition for #sustainable #healthsystems through Reduce and Support"— #newstudy published in @bmj.com #GlobalHealth by BCEPS Researcher (& PhD grad) Anand Bhopal & colleagues 🌍
📄 👉 Link #openaccess: gh.bmj.com/content/8/Su...
📸 Fateme Alaei
#climatechange
📄 👉 Link #openaccess: gh.bmj.com/content/8/Su...
📸 Fateme Alaei
#climatechange

January 16, 2025 at 2:31 PM
#NetZero is not enough: ratcheting ambition for #sustainable #healthsystems through Reduce and Support"— #newstudy published in @bmj.com #GlobalHealth by BCEPS Researcher (& PhD grad) Anand Bhopal & colleagues 🌍
📄 👉 Link #openaccess: gh.bmj.com/content/8/Su...
📸 Fateme Alaei
#climatechange
📄 👉 Link #openaccess: gh.bmj.com/content/8/Su...
📸 Fateme Alaei
#climatechange
Reposted by Castory Munishi
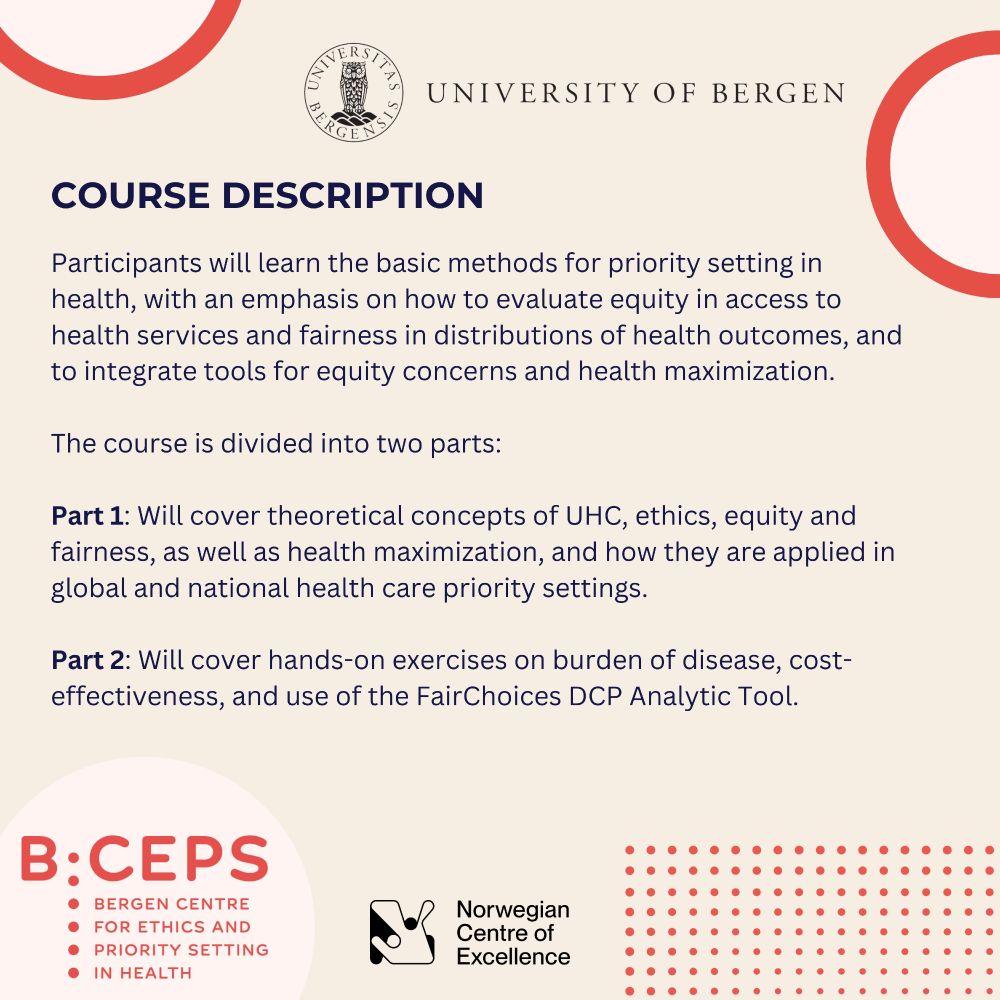
📢 BCEPS is proud to announce a free 2-week online course on priority setting in health, led by Kjell Arne Johansson
& featuring international expert lecturers! 💥
Anyone around the world can take this course. This is a rare and valuable opportunity—please share widely! 💡
See more info below👇
& featuring international expert lecturers! 💥
Anyone around the world can take this course. This is a rare and valuable opportunity—please share widely! 💡
See more info below👇


January 7, 2025 at 3:22 PM
📢 BCEPS is proud to announce a free 2-week online course on priority setting in health, led by Kjell Arne Johansson
& featuring international expert lecturers! 💥
Anyone around the world can take this course. This is a rare and valuable opportunity—please share widely! 💡
See more info below👇
& featuring international expert lecturers! 💥
Anyone around the world can take this course. This is a rare and valuable opportunity—please share widely! 💡
See more info below👇
Reposted by Castory Munishi

International vs domestic flights for this week's #TidyTuesday
Code: github.com/gkaramanis/t...
#RStats #dataviz
Code: github.com/gkaramanis/t...
#RStats #dataviz

December 27, 2024 at 1:00 PM
International vs domestic flights for this week's #TidyTuesday
Code: github.com/gkaramanis/t...
#RStats #dataviz
Code: github.com/gkaramanis/t...
#RStats #dataviz
Reposted by Castory Munishi
Day 10: Code readability!
Are you making life harder for yourself in R? Or are you using rainbow parentheses and highlighted functions!?
Which one does your code look like?
Are you making life harder for yourself in R? Or are you using rainbow parentheses and highlighted functions!?
Which one does your code look like?

December 10, 2024 at 4:30 PM
Day 10: Code readability!
Are you making life harder for yourself in R? Or are you using rainbow parentheses and highlighted functions!?
Which one does your code look like?
Are you making life harder for yourself in R? Or are you using rainbow parentheses and highlighted functions!?
Which one does your code look like?
Reposted by Castory Munishi
So if you're curious about GIS or just starting with spatial epi data? Check out Chapter 28 for a deep dive into concepts, code, and examples: www.epirhandbook.com/en/new_pages...
And don’t forget to experiment with mapview. Probably the easiest map you'll ever make.
And don’t forget to experiment with mapview. Probably the easiest map you'll ever make.
28 GIS basics – The Epidemiologist R Handbook
www.epirhandbook.com
December 6, 2024 at 6:24 PM
So if you're curious about GIS or just starting with spatial epi data? Check out Chapter 28 for a deep dive into concepts, code, and examples: www.epirhandbook.com/en/new_pages...
And don’t forget to experiment with mapview. Probably the easiest map you'll ever make.
And don’t forget to experiment with mapview. Probably the easiest map you'll ever make.
Reposted by Castory Munishi
Under the hood of mapview is Leaflet rstudio.github.io/leaflet/. Which is a bit more complex but a lot more powerful. In the chapter, we guide you through how to:
📂 Load spatial data
🗺️ Create static maps
🌐 Build interactive maps
📊 Perform basic spatial analyses
📂 Load spatial data
🗺️ Create static maps
🌐 Build interactive maps
📊 Perform basic spatial analyses
rstudio.github.io
December 6, 2024 at 6:24 PM
Under the hood of mapview is Leaflet rstudio.github.io/leaflet/. Which is a bit more complex but a lot more powerful. In the chapter, we guide you through how to:
📂 Load spatial data
🗺️ Create static maps
🌐 Build interactive maps
📊 Perform basic spatial analyses
📂 Load spatial data
🗺️ Create static maps
🌐 Build interactive maps
📊 Perform basic spatial analyses
Reposted by Castory Munishi
We use mapview to:
Pinpoint where our spatial data is located. 📍
Save interactive maps as HTML files to share with colleagues. 🌐
Quickly explore patterns and trends in spatial data. 🔍
GIS doesn’t have to be daunting, tools like mapview make mapping simple and accessible for everyone! 🚀
Pinpoint where our spatial data is located. 📍
Save interactive maps as HTML files to share with colleagues. 🌐
Quickly explore patterns and trends in spatial data. 🔍
GIS doesn’t have to be daunting, tools like mapview make mapping simple and accessible for everyone! 🚀
December 6, 2024 at 6:24 PM
We use mapview to:
Pinpoint where our spatial data is located. 📍
Save interactive maps as HTML files to share with colleagues. 🌐
Quickly explore patterns and trends in spatial data. 🔍
GIS doesn’t have to be daunting, tools like mapview make mapping simple and accessible for everyone! 🚀
Pinpoint where our spatial data is located. 📍
Save interactive maps as HTML files to share with colleagues. 🌐
Quickly explore patterns and trends in spatial data. 🔍
GIS doesn’t have to be daunting, tools like mapview make mapping simple and accessible for everyone! 🚀
Reposted by Castory Munishi
Enter mapview! This package takes spatial objects like sf and creates an interactive map easily. r-spatial.github.io/mapview/
library(mapview)
mapview(your_sf_object)
That’s it. One line, and you’ve got a clickable, zoomable map! Try it yourself. 🖱️📍
library(mapview)
mapview(your_sf_object)
That’s it. One line, and you’ve got a clickable, zoomable map! Try it yourself. 🖱️📍
Interactive Viewing of Spatial Data in R
Quickly and conveniently create interactive
visualisations of spatial data with or without background maps.
Attributes of displayed features are fully queryable via pop-up
windows. Additio...
r-spatial.github.io
December 6, 2024 at 6:24 PM
Enter mapview! This package takes spatial objects like sf and creates an interactive map easily. r-spatial.github.io/mapview/
library(mapview)
mapview(your_sf_object)
That’s it. One line, and you’ve got a clickable, zoomable map! Try it yourself. 🖱️📍
library(mapview)
mapview(your_sf_object)
That’s it. One line, and you’ve got a clickable, zoomable map! Try it yourself. 🖱️📍
Reposted by Castory Munishi
Day 6: Today’s is Chapter 28 of the EpiR Handbook: GIS because Epis love maps! 🗺️
🌍 Learn how to make spatial data work for you: www.epirhandbook.com/en/new_pages...
But let’s make this even easier. Did you know you can create an interactive map in R with just one line of code? 🤯 Follow along 👇
🌍 Learn how to make spatial data work for you: www.epirhandbook.com/en/new_pages...
But let’s make this even easier. Did you know you can create an interactive map in R with just one line of code? 🤯 Follow along 👇
28 GIS basics – The Epidemiologist R Handbook
www.epirhandbook.com
December 6, 2024 at 6:24 PM
Day 6: Today’s is Chapter 28 of the EpiR Handbook: GIS because Epis love maps! 🗺️
🌍 Learn how to make spatial data work for you: www.epirhandbook.com/en/new_pages...
But let’s make this even easier. Did you know you can create an interactive map in R with just one line of code? 🤯 Follow along 👇
🌍 Learn how to make spatial data work for you: www.epirhandbook.com/en/new_pages...
But let’s make this even easier. Did you know you can create an interactive map in R with just one line of code? 🤯 Follow along 👇
We live, we learn
November 22, 2024 at 5:28 AM
We live, we learn
Stop running in cycles. Just do it!
November 20, 2024 at 11:03 AM
Stop running in cycles. Just do it!
Fame is unnatural.
November 9, 2024 at 6:09 AM
Fame is unnatural.
Procastination is a poison that kills success
October 20, 2024 at 10:37 PM
Procastination is a poison that kills success
Focused work needs headspace
October 20, 2024 at 10:36 PM
Focused work needs headspace
“No matter how difficult life may seem there is always something you can do and succeed at” Stephen Hawking
Just keep pushing
Just keep pushing
November 24, 2023 at 9:30 PM
“No matter how difficult life may seem there is always something you can do and succeed at” Stephen Hawking
Just keep pushing
Just keep pushing
“Things are just things they don’t make you who you are” Macklemore
November 11, 2023 at 10:28 AM
“Things are just things they don’t make you who you are” Macklemore
Sometimes where we are boils down to one insane move
November 11, 2023 at 10:24 AM
Sometimes where we are boils down to one insane move
No matter how difficult the journey may seem, don’t quit
October 2, 2023 at 8:02 AM
No matter how difficult the journey may seem, don’t quit
Play long time games
September 25, 2023 at 6:08 PM
Play long time games
Don’t count the number of failures, count the number of comebacks!
September 20, 2023 at 8:07 AM
Don’t count the number of failures, count the number of comebacks!
Compound interest works
September 7, 2023 at 7:06 AM
Compound interest works
Remember time is a river
September 5, 2023 at 9:19 AM
Remember time is a river