


Christopher Chizinski
@chrischizinski.bsky.social
Associate professor of human dimensions in the School of Natural Resources at the University of Nebraska #rstats enthusiast
Reposted by Christopher Chizinski

Exploring Complex Survey Data Analysis Using R by Stephanie A. Zimmer, Rebecca J. Powell and Isabella C. Velásquez
#RStats
https://bigbookofr.com/chapters/social%20science.html#exploring-complex-survey-data-analysis-using-r
#RStats
https://bigbookofr.com/chapters/social%20science.html#exploring-complex-survey-data-analysis-using-r
July 9, 2025 at 8:13 PM
Exploring Complex Survey Data Analysis Using R by Stephanie A. Zimmer, Rebecca J. Powell and Isabella C. Velásquez
#RStats
https://bigbookofr.com/chapters/social%20science.html#exploring-complex-survey-data-analysis-using-r
#RStats
https://bigbookofr.com/chapters/social%20science.html#exploring-complex-survey-data-analysis-using-r
Reposted by Christopher Chizinski

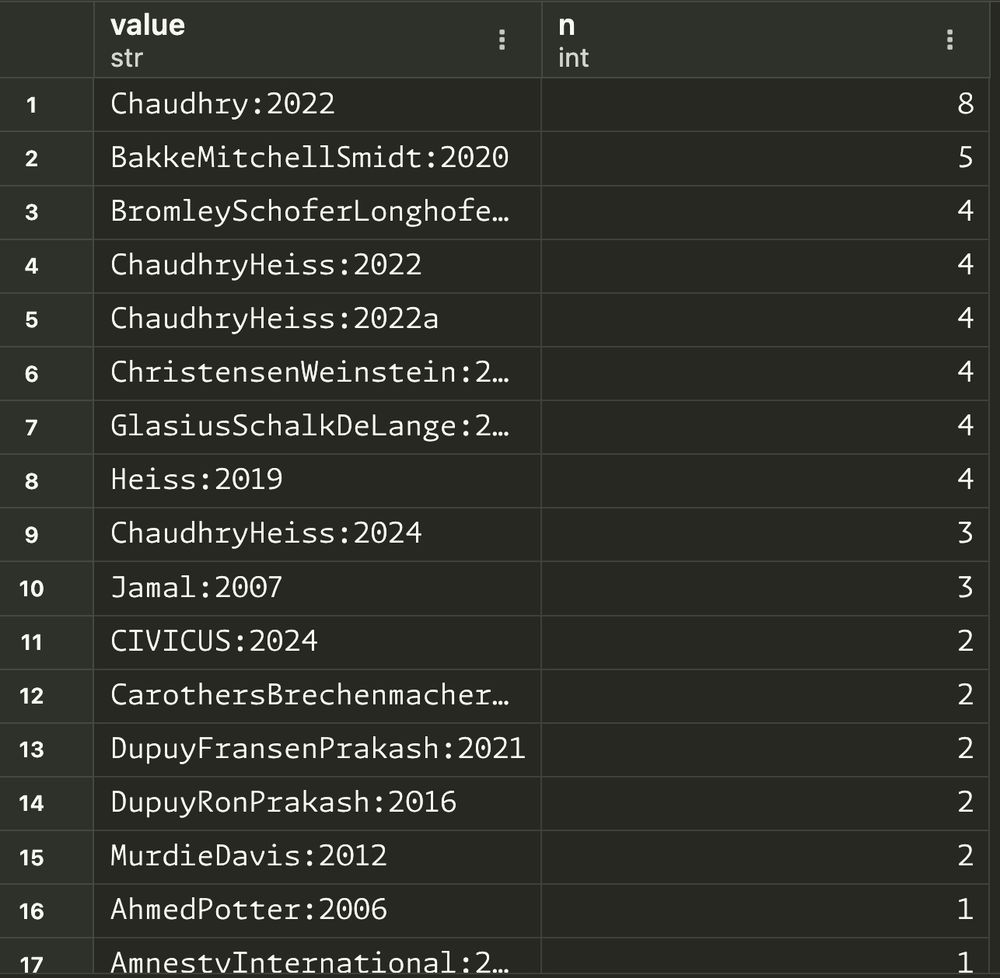
Helpful trick for academic writing with #QuartoPub: sometimes when trimming down papers, you've got to remove references (ugh—bibliographies shouldn't count in word counts!) so I use this #rstats snippet to extract all citations & and find things that I've only used once to see if they're droppable
![library(tidyverse)
citekeys <- read_file("manuscript.qmd") |>
str_extract_all("@([A-Za-z0-9_:]+)") |>
unlist() |>
str_remove_all("^@") |>
as_tibble() |>
count(value) |>
arrange(desc(n))](https://cdn.bsky.app/img/feed_thumbnail/plain/did:plc:2zcfjzyocp6kapg6jc4eacok/bafkreicrjengdhqprxl6xqxq4syugggpvcabskfek2lxackxnguywvfnze@jpeg)
March 28, 2025 at 6:06 PM
Helpful trick for academic writing with #QuartoPub: sometimes when trimming down papers, you've got to remove references (ugh—bibliographies shouldn't count in word counts!) so I use this #rstats snippet to extract all citations & and find things that I've only used once to see if they're droppable

Reposted by Christopher Chizinski


apnews.com/young-scient... scientists see career pathways vanish as schools adapt to federal funding cuts

Young scientists see career pathways vanish as schools adapt to federal funding cuts
Reductions to federal support for research at universities and other institutions under President Donald Trump are dimming young scientists’ prospects, cutting off pathways to career-building projects...
apnews.com
March 17, 2025 at 1:09 AM
apnews.com/young-scient... scientists see career pathways vanish as schools adapt to federal funding cuts
Reposted by Christopher Chizinski
Two years ago I wrote a 3 part blog post on Data Cleaning for Data Sharing for #LoveDataWeek that I think is still relevant for #LoveData25.
1. cghlewis.com/blog/data_cl...
2. cghlewis.com/blog/data_cl...
3. cghlewis.com/blog/data_cl...
#rstats #databs #edusky
1. cghlewis.com/blog/data_cl...
2. cghlewis.com/blog/data_cl...
3. cghlewis.com/blog/data_cl...
#rstats #databs #edusky

Data cleaning for data sharing | Crystal Lewis
Part 1 in a series on creating a data cleaning workflow
cghlewis.com
February 12, 2025 at 12:46 PM
Two years ago I wrote a 3 part blog post on Data Cleaning for Data Sharing for #LoveDataWeek that I think is still relevant for #LoveData25.
1. cghlewis.com/blog/data_cl...
2. cghlewis.com/blog/data_cl...
3. cghlewis.com/blog/data_cl...
#rstats #databs #edusky
1. cghlewis.com/blog/data_cl...
2. cghlewis.com/blog/data_cl...
3. cghlewis.com/blog/data_cl...
#rstats #databs #edusky
Reposted by Christopher Chizinski

#rstats {lintr} finally got a hex logo! Thanks to @gregswinehart.bsky.social! And of course @hadley.nz for the initiative.

December 20, 2024 at 6:26 AM
#rstats {lintr} finally got a hex logo! Thanks to @gregswinehart.bsky.social! And of course @hadley.nz for the initiative.
Reposted by Christopher Chizinski

Check out the book DevOps for Data Science by Alex Gold.
Want your work to make a real impact? DO4DS is your guide to bringing you & your team's analytic insights into production. Learn more at posit.co/blog/devops-...
#rstats #datascience #devops #pydata
Want your work to make a real impact? DO4DS is your guide to bringing you & your team's analytic insights into production. Learn more at posit.co/blog/devops-...
#rstats #datascience #devops #pydata

December 20, 2024 at 5:01 PM
Check out the book DevOps for Data Science by Alex Gold.
Want your work to make a real impact? DO4DS is your guide to bringing you & your team's analytic insights into production. Learn more at posit.co/blog/devops-...
#rstats #datascience #devops #pydata
Want your work to make a real impact? DO4DS is your guide to bringing you & your team's analytic insights into production. Learn more at posit.co/blog/devops-...
#rstats #datascience #devops #pydata
Reposted by Christopher Chizinski

I was today years old when I found this gem of a web app to explore 2500+ color palettes for R:
r-graph-gallery.com/color-palett...
r-graph-gallery.com/color-palett...

R Color Palette Finder
The ultimate tool for finding the perfect color palette for data visualization with R and paletteer. Explore over 2000 palettes, see them in action on various charts, simulate color blindness, and exp...
r-graph-gallery.com
December 20, 2024 at 8:09 PM
I was today years old when I found this gem of a web app to explore 2500+ color palettes for R:
r-graph-gallery.com/color-palett...
r-graph-gallery.com/color-palett...
Reposted by Christopher Chizinski

In case you missed it, last Friday I finally launched The Last Hunt for the Jabberwock, a D&D 5e Adventure with lesson plans and learning standards for environmental educators.
You can also just play the campaign on its own. I think it's pretty fun!
www.southernfriedscience.com/hunt-the-jab...
You can also just play the campaign on its own. I think it's pretty fun!
www.southernfriedscience.com/hunt-the-jab...

Hunt the Jabberwock, Defend the Warren, Save the Forest: a D&D 5e Adventure for Environmental Educators
Welcome to the Warren. Within this tiny Domain of Delight, Rabbitfolk engage in an endless battle against the Jabberwock, a manxome foe that refuses to stay dead. With the aid of their Archfey and …
www.southernfriedscience.com
December 16, 2024 at 7:07 PM
In case you missed it, last Friday I finally launched The Last Hunt for the Jabberwock, a D&D 5e Adventure with lesson plans and learning standards for environmental educators.
You can also just play the campaign on its own. I think it's pretty fun!
www.southernfriedscience.com/hunt-the-jab...
You can also just play the campaign on its own. I think it's pretty fun!
www.southernfriedscience.com/hunt-the-jab...
Reposted by Christopher Chizinski

📝 "Positron in action with #TidyTuesday orca encounters"
👤 Julia Silge
🔗 https://juliasilge.com/blog/orcas-positron/
#rladies#rstats
👤 Julia Silge
🔗 https://juliasilge.com/blog/orcas-positron/
#rladies#rstats
November 22, 2024 at 7:19 AM
📝 "Positron in action with #TidyTuesday orca encounters"
👤 Julia Silge
🔗 https://juliasilge.com/blog/orcas-positron/
#rladies#rstats
👤 Julia Silge
🔗 https://juliasilge.com/blog/orcas-positron/
#rladies#rstats
Reposted by Christopher Chizinski

My new 3D elevation map of the Iberian Peninsula🇦🇩🇪🇸🇵🇹 shows the intricate river systems overlayed with the exaggerated terrain.
Curious about how I create relief maps like this one? Dive into my video tutorial and explore the process:
🔗 youtu.be/piswxAEwnYo
#rstats #dataviz #GIS #maps #coding
Curious about how I create relief maps like this one? Dive into my video tutorial and explore the process:
🔗 youtu.be/piswxAEwnYo
#rstats #dataviz #GIS #maps #coding

November 17, 2024 at 6:09 PM
Reposted by Christopher Chizinski

Getting involved in open source projects is a great way to develop your programming skills! As well as creating plots or shiny apps using the #TidyTuesday data, curating a dataset is a good way to contribute!
How to contribute 👇👇👇
#DLSC #RStats #Python #DataScience @dslc.io
How to contribute 👇👇👇
#DLSC #RStats #Python #DataScience @dslc.io

November 15, 2024 at 3:50 PM
Getting involved in open source projects is a great way to develop your programming skills! As well as creating plots or shiny apps using the #TidyTuesday data, curating a dataset is a good way to contribute!
How to contribute 👇👇👇
#DLSC #RStats #Python #DataScience @dslc.io
How to contribute 👇👇👇
#DLSC #RStats #Python #DataScience @dslc.io
Reposted by Christopher Chizinski

~~ new blog post ~~
i wrote about the meme that academic code is bad, what i think is achievable, and why i don't think we should be trying to get academics to write software for production
would love to hear what folks think!
#rstats #pydata
www.alexpghayes.com/post/what-i-...
i wrote about the meme that academic code is bad, what i think is achievable, and why i don't think we should be trying to get academics to write software for production
would love to hear what folks think!
#rstats #pydata
www.alexpghayes.com/post/what-i-...


November 15, 2024 at 4:06 PM
~~ new blog post ~~
i wrote about the meme that academic code is bad, what i think is achievable, and why i don't think we should be trying to get academics to write software for production
would love to hear what folks think!
#rstats #pydata
www.alexpghayes.com/post/what-i-...
i wrote about the meme that academic code is bad, what i think is achievable, and why i don't think we should be trying to get academics to write software for production
would love to hear what folks think!
#rstats #pydata
www.alexpghayes.com/post/what-i-...
Reposted by Christopher Chizinski
I really enjoyed talking about the @royalstatsoc.bsky.social's "Best Practices for Data Visualisation" guidance, for the Centre for Marketing Analytics and Forecasting talk this afternoon 📊
Thanks to @kandrika.bsky.social for the invitation and for chairing the session!
#RStats #DataViz
Thanks to @kandrika.bsky.social for the invitation and for chairing the session!
#RStats #DataViz

November 15, 2024 at 2:53 PM
I really enjoyed talking about the @royalstatsoc.bsky.social's "Best Practices for Data Visualisation" guidance, for the Centre for Marketing Analytics and Forecasting talk this afternoon 📊
Thanks to @kandrika.bsky.social for the invitation and for chairing the session!
#RStats #DataViz
Thanks to @kandrika.bsky.social for the invitation and for chairing the session!
#RStats #DataViz
Reposted by Christopher Chizinski
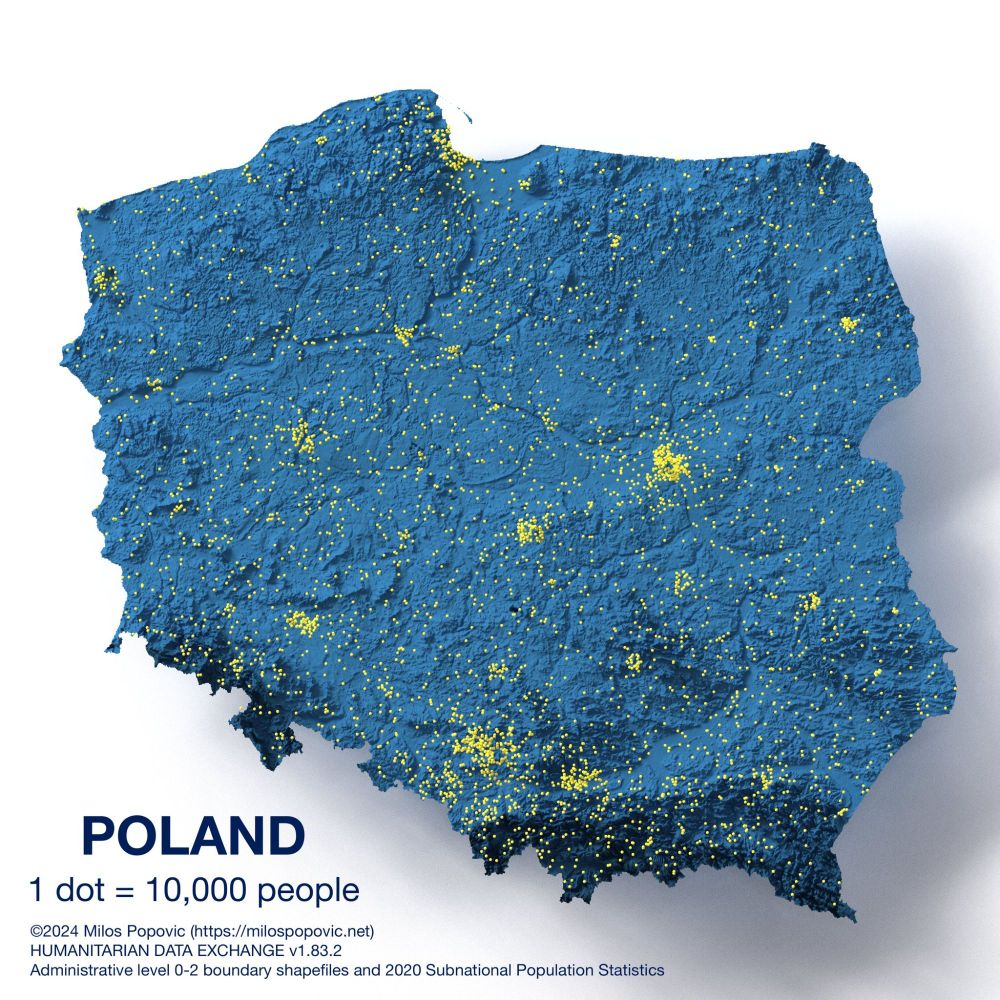
Check out my dot-density map of Poland's🇵🇱 population by powiat (admin level 2).
1 dot = 10,000 people, randomly placed within their powiat.
Can you spot the most populated regions? 🧐
Learn to create maps like this with my YouTube tutorial!
youtu.be/aUA1Sb6IBVQ
#maps #dataviz #rstats #Poland
1 dot = 10,000 people, randomly placed within their powiat.
Can you spot the most populated regions? 🧐
Learn to create maps like this with my YouTube tutorial!
youtu.be/aUA1Sb6IBVQ
#maps #dataviz #rstats #Poland
November 17, 2024 at 9:49 AM
Check out my dot-density map of Poland's🇵🇱 population by powiat (admin level 2).
1 dot = 10,000 people, randomly placed within their powiat.
Can you spot the most populated regions? 🧐
Learn to create maps like this with my YouTube tutorial!
youtu.be/aUA1Sb6IBVQ
#maps #dataviz #rstats #Poland
1 dot = 10,000 people, randomly placed within their powiat.
Can you spot the most populated regions? 🧐
Learn to create maps like this with my YouTube tutorial!
youtu.be/aUA1Sb6IBVQ
#maps #dataviz #rstats #Poland
Reposted by Christopher Chizinski

Using Generalized Additive Models in #rstats but unsure how to interpret them? The {marginaleffects} 📦 by @vincentab.bsky.social is your friend ecogambler.netlify.app/blog/interpr...

How to interpret and report nonlinear effects from Generalized Additive Models | GAMbler
Generalized additive models (GAMs) are incredibly flexible tools that fit penalized regression splines to data. But interpreting nonlinear effects from GAMs is not as easy as interpreting linear model...
ecogambler.netlify.app
November 16, 2024 at 6:52 PM
Using Generalized Additive Models in #rstats but unsure how to interpret them? The {marginaleffects} 📦 by @vincentab.bsky.social is your friend ecogambler.netlify.app/blog/interpr...
Reposted by Christopher Chizinski
The {messy} R package now has a pkgdown site with documentation: nrennie.rbind.io/messy/
#RStats #StatsEd
#RStats #StatsEd
November 17, 2024 at 4:16 PM
The {messy} R package now has a pkgdown site with documentation: nrennie.rbind.io/messy/
#RStats #StatsEd
#RStats #StatsEd