Colorado Climate Center
@climate.colostate.edu
2.6K followers
130 following
120 posts
Climate monitoring, climate research, and climate services for Colorado.
Based at the Department of Atmospheric Science, Colorado State University. https://climate.colostate.edu
Posts
Media
Videos
Starter Packs
Reposted by Colorado Climate Center


Reposted by Colorado Climate Center

The Colorado Sun ☀️
@coloradosun.com
· Aug 27

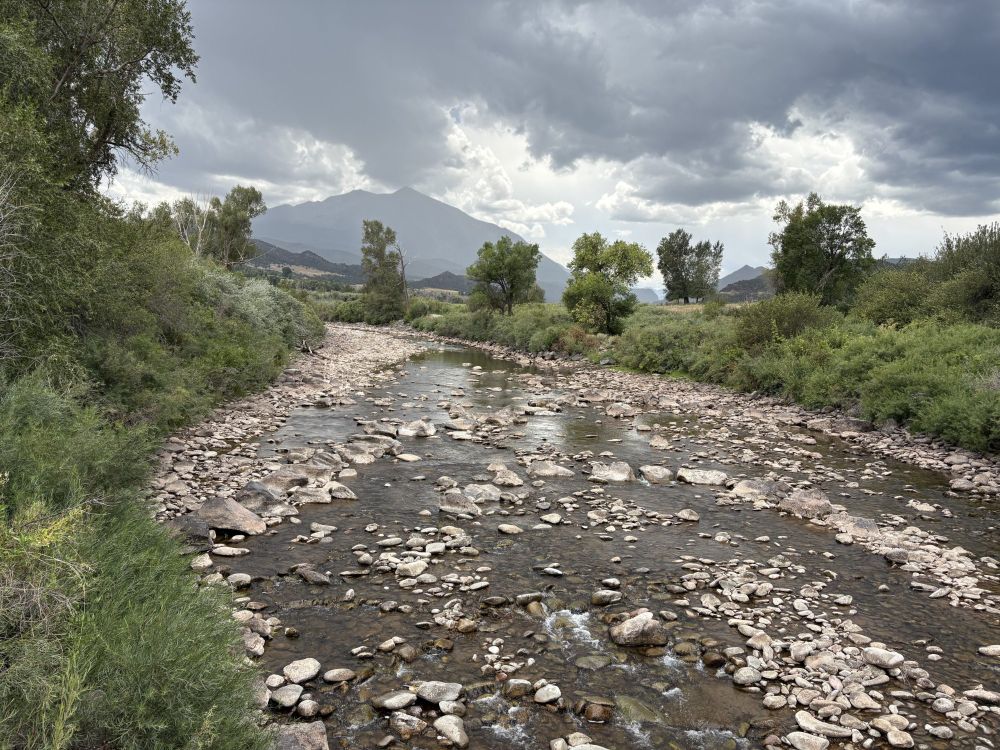
Monsoonal rains are dousing western Colorado wildfires. They also come with serious flood concerns.
Local officials and weather experts are watching burn scars in Colorado as monsoon rains elevate the risk of debris flows and flash floods.
coloradosun.com
Reposted by Colorado Climate Center


Reposted by Colorado Climate Center


Reposted by Colorado Climate Center
