Climate Central
@climatecentral.org
6.7K followers 620 following 670 posts
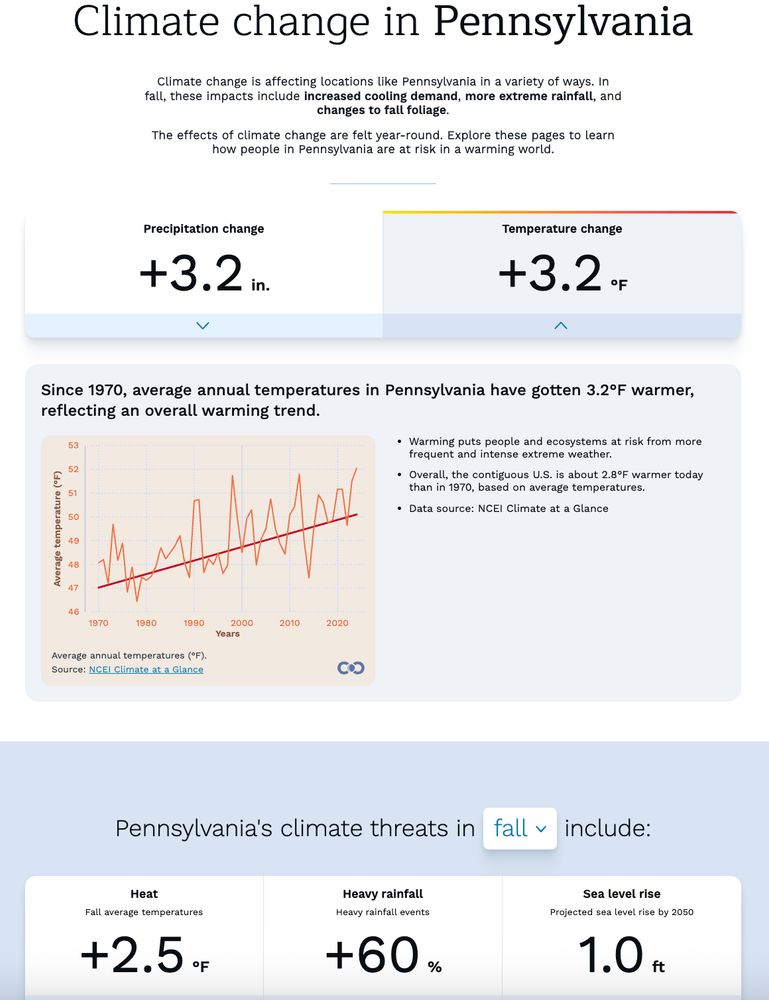
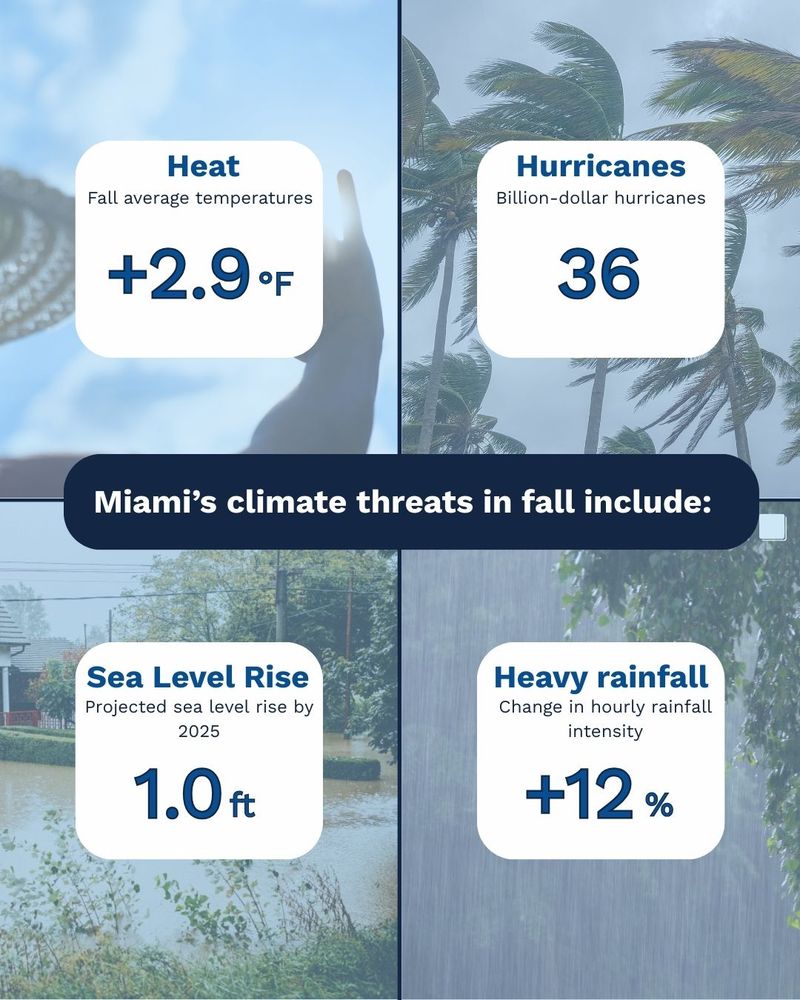
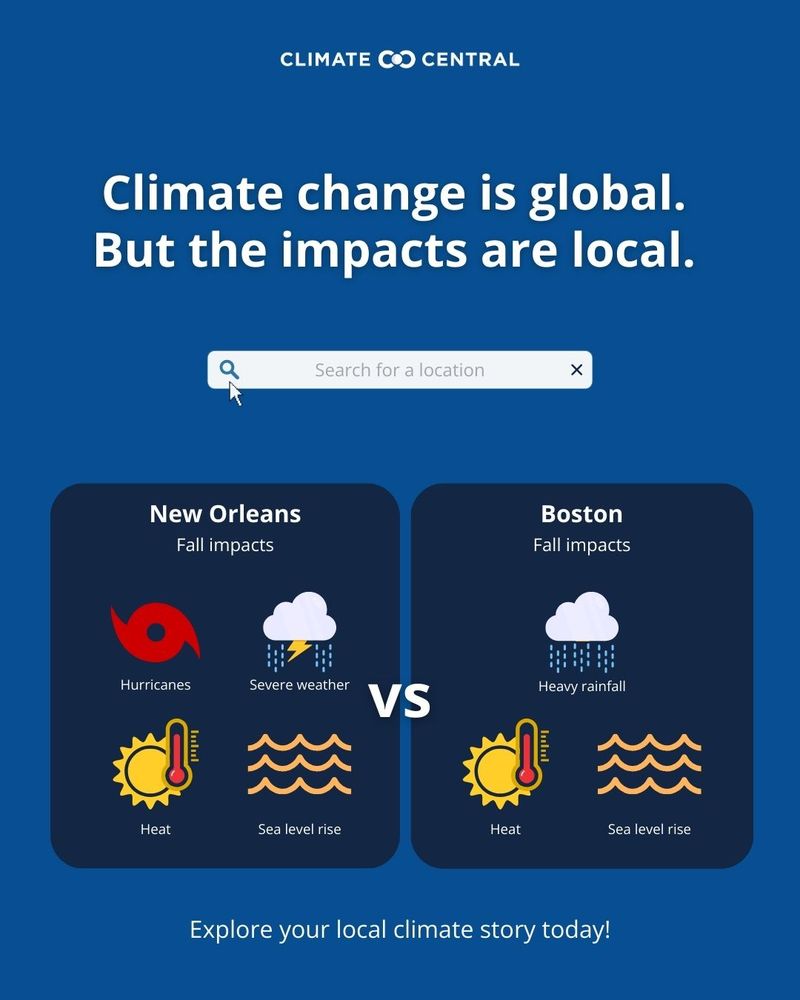
Researching and reporting the science and impacts of climate change 🌎 climatecentral.org
Posts Media Videos Starter Packs
climatecentral.org
California has just switched on its first canal solar project, transforming two Central Valley irrigation canals into power sources.
As Ben Tracy reports, research suggests this approach could help California save more than 60 billion gallons of water every year.
www.youtube.com/watch?v=He1l...
Solar Canals: Creating Clean Energy Corridors
YouTube video by climatecentral
www.youtube.com
climatecentral.org
Where Jerry is forecast to strengthen into a Cat 1–2 hurricane, mid-80°F waters are unusually hot for early October.

Ocean heat made at least 200x–300x more likely to be 1–2°F above average by heat-trapping pollution.

🔴More ocean heat = stronger, faster-intensifying storms.
Map showing Tropical Storm Jerry’s track across the Atlantic on Oct 6, 2025. The storm moves over areas of unusually warm water—made 10x–20x more likely by climate change early in its path and up to 200x–300x more likely near the Caribbean.
climatecentral.org
Tropical Storm #Jerry formed Tuesday, expected to turn north before reaching the Caribbean.

An October storm isn’t unusual...but the ocean heat feeding it is.

So far, Jerry’s traveled over above-average warmth made 10x–20x more likely by human-caused climate change.
🧵/1
climatecentral.org
TODAY!

⏰ Noon ET

Join us & @climateconnections.bsky.social to explore:
• Why king tides matter for coastal communities
• How they've evolved over decades
• What they tell us about climate change

Register 👉 yale.zoom.us/webinar/regi...

See you there!
climatecentral.org
🌡️All-time record heat expected across MN, WI, ND, SD Saturday (10/4)

🔴Unusual heat 20° - 25° ABOVE average for early October. Temperatures made 3x to 4x MORE likely due to human-caused climate change.

🗣️Simply: heat rare here at this time of the year without a fingerprint of climate change
climatecentral.org
🌊 Ever wondered what coastal flooding will look like in 20 years? King Tides are giving us a glimpse right now.

These aren't your average high tides—they're the highest of the year, and as seas rise, they're increasingly showing us what "normal" tides could look like in our future.
climatecentral.org
Climate change is making heat waves longer & hotter—pushing summer heat deeper into fall and worsening extreme weather.

At college football sites, “extremely hot days” are up 88% since 1970. 🏈

🏈Climate Change's impacts on football season ▶️ impactsus.org/cfb/

(via @impactsus.bsky.social)
U.S. map showing increases in extremely hot days (1970–2023). Most college football locations, especially in the South and East, have seen more hot days, marked in red and brown.
Reposted by Climate Central
lucyrohden.bsky.social
According to Climate Central, it’s going to be 18 degrees warmer than normal in Ann Arbor this weekend! That’s hot (in a bad way!)

Visit impactsus.org/cfb to learn more. @impactsus.bsky.social
climatecentral.org
📊RESOURCES:

• U.S. Drought Monitor | droughtmonitor.unl.edu/CurrentMap.a...

• Warmer, Thirstier Air Worsens Drought | www.climatecentral.org/climate-matt...
climatecentral.org
🌡️ As the atmosphere’s “thirst” rises exponentially with warming, so does the risk of drought.

Each bit of added warming increases the potential for droughts to grow longer, larger, and more severe.

It slows the ability to recover, which in turn worsens the wildfire risk
🧵/4
Two U.S. maps show drought severity drivers. Earlier decades mostly brown (driven by low precipitation). Recent decades show widespread red in the West, meaning heat is now the main driver.
climatecentral.org
💧 Water is essential—but not evenly shared.

Climate change is amplifying both extremes of the water cycle, leaving people to face either too much or too little water.

Since the early 1900s:
🏜️ Western U.S. has grown drier
🌧️ Eastern U.S. has grown wetter
🧵/3
Map of the U.S. with the West shaded brown (more extreme drought) and the East shaded green (more extreme moisture).
climatecentral.org
As temps rise, the atmosphere gets “thirstier”—pulling more water from streams, soils & plants. That worsens drought & fuels wildfire risk. 🔥🌵

In the West, lack of rain/snow once drove drought. Since 2000, human-caused warming & atmospheric thirst have taken the lead.
🧵/2
Illustration shows warmer, thirstier air pulling water from soil, plants, and streams. Leads to shrinking water supplies, higher wildfire risk, and crop/livestock harm.
climatecentral.org
🏜️ Let’s talk #drought

After a “summer of flooding” in many U.S. locations, the last 2 months have seen the tap shut off for a large portion of the country:
⬆️ 25% increase in abnormally dry areas
⬆️ 12% rise in drought (D1–D4)
🧵/1
climatecentral.org
Don't miss this COP30 discussion on October 9 with @coveringclimatenow.org and 3 Brazilian reporters!
coveringclimatenow.org
Covering COP30? Join CCNow and 3 Brazilian reporters for a one-hour discussion about how they're gearing up to cover the upcoming UN climate summit, on October 9, 12pm ET. coveringclimatenow.org/event/coveri...
Covering the COP in the Amazon

PANELISTS: 
Miguel Peixe, Product Engineer, Newspack
Steffanie Schmidt, Reporter, Varadouro
Stefano Wrobleski, Executive Director, InfoAmazonia
Mark Hertsgaard, CCNow Co-founder and Executive Director, will moderate.
Reposted by Climate Central
zacklabe.com
📣 Check it out! Explore the new data viz on our homepage: www.climatecentral.org

@climatecentral.org just released a new tool to explore climate impacts in U.S. cities and states - making complex data easier to understand for your community.

🚨 What’s the biggest Fall climate threat where you live?
Example of the new climate tool from Climate Central. This is showing climate change in Pennsylvania which is seeing annually a change in precipitation of 3.2 inches since 1970 and a warming of 3.2°F. Fall threats include heat, heavy rainfall, and sea level rise. This is associated with impacts like increased cooling demand, more extreme rainfall, and changes to fall foliage.
climatecentral.org
Bookmark the link below or head to our homepage, and stay tuned! We’ll be regularly updating the content as the seasons change to make sure you have access to the most timely and relevant climate info available for >240 U.S. cities and every state. 3/3 www.climatecentral.org/climate-local
Climate change’s effect on local areas | Climate Central
Get information, data, and shareable graphics about how climate change is affecting over 200 U.S. cities and all 50 U.S. states, by location.
www.climatecentral.org
climatecentral.org
Whether you’re a journalist covering climate, a teacher introducing students to environmental impacts, or just someone who wants to understand how weather has changed where you live — you’ll find our data, visuals and text helpful in transforming numbers into narratives.
2/3
4 panel image with text in middle that says Miami's climate threats in fall include. Each window pane is a different impact, heat, hurricanes, sea level rise and heavy rainfall facts are in white boxes in each window. Background images relate to each impact with a focus on tropical Miami.
climatecentral.org
Climate change is global. But the impacts are felt locally. Climate Central has a new feature that can help you tell your city’s climate story, finding the impacts that matter the most for you and your community. 1/2
www.climatecentral.org/climate-local
Title Climate change is global. But the impacts are local. White search bar underneath then two dark blue boxes side by side. One for New Orleans, the other for Boston. Each showing different fall impacts from climate change. Icons for heat, hurricanes, rainfall, sea level rise and severe weather are present.
climatecentral.org
Warmer, thirstier air is making droughts worse in the western U.S. bit.ly/warmer-thirs... #climatematters
climatecentral.org
Join for this October speaker series: “Climate Matters: translating science into stories.”

📅 Thursday, October 2 | 2pm ET
🗣️ @bernwoodsplacky.bsky.social

🔗 osu.zoom.us/meeting/regi...
climatecentral.org
📊RESOURCES:

• CLIMATE SHIFT INDEX ALERT: Imelda | www.climatecentral.org/climate-shif...

• Climate Change's Impacts on #Imelda | www.climatecentral.org/tropical-cyc...

• Climate Change's Impacts on #Humberto | www.climatecentral.org/tropical-cyc...
climatecentral.org
Additional ocean warmth #Imelda will encounter as a hurricane in the coming days will increase the storm's projected peak wind speed by ~10mph.

Put simply, Imelda is forecast to reach Category 2 strength; without climate change, it would only peak as a Category 1 storm.
🧵/2
Climate change boosted Imelda: stronger winds, Cat 1→2, +1.1°C warmer seas, oceans 7–100x more likely this warm.