Anne-Sophie Pereira De Sá
@curiousdata.bsky.social
1.4K followers 570 following 86 posts
Over-analyses TV series, music, my cat and Eurovision in #dataviz By day, data analyst at LinkedIn Tableau's #VizoftheDay three times, Top 10 in #Ironviz in 2021 Website: https://curiousdata.netlify.app/ She/her
Posts Media Videos Starter Packs
Pinned
curiousdata.bsky.social
[Wrap up 2024] Creativity wise, I have stalled, as I have dedicated time and energy learning
#d3, #Svelte and all the basics, eg #Javascript 😑
To wrap up 2024 on a cheerful note, I have crafted datavizreadytogo.netlify.app with everything I now know, with the goal to be more creative in 2025! 🌸
Line chart entitled → Time spent learning dataviz VS ↑ levels of confidence I'll be able to pull a line chart, expectations Vs reality
The expectations line shows a steady upward trend but the reality line shows a much messier journey, where your confidence is high at the beginning and rapidly declines, reaching even negative levels. But then it gets better with time.
A scatterplot entitled → Number of pets VS ↑ levels of happiness, where you see that the happiness grows with the number of pets until you get to 7 pets and your level of happiness declines rapidly Screenshot of a stacked bar chart entitled Espresso / Steamed Milk / Milk foam ratios in different coffees. 
For example, a macchiato has one dose of espresso and one of steamed milk but zero dose of milk foam.
A column chart entitled ↑ Number of toes per animal where you learn a horse has 1 toe, a sheep 2, an opossum 5, a heron 3 and both cats and dogs have 4. Per paw/foot.
curiousdata.bsky.social
In today's edition of "Data articles I didn’t know I needed to read" 🧅✨
pudding.cool/2025/08/onio...
#DigThisViz #DataStorytelling #UnexpectedlyBrilliant
Dicing an Onion, the Mathematically Optimal Way
There is more than one way to dice an onion…
pudding.cool
Reposted by Anne-Sophie Pereira De Sá
jacqueschrag.com
Desperately need a word for when you hate the subject of a data, but like the visual. My latest combines a comparison chart & cartogram to show which states allow prisons to charge "pay-to-stay" fees. #dataviz
curiousdata.bsky.social
Ah, looking at your previous code and wondering what fever brought you to write this or that 🤭
curiousdata.bsky.social
that's good to hear! One of my struggles learning Svelte (and perhaps, code in general to be honest) is "what did I do wrong or is this because of the position of the planets?" 😆
curiousdata.bsky.social
👀 Dataviz folks, anyone using Svelte 5 yet? 😗📊

Curious how it feels for visualisation work:
🟢 Easier?
🟡 Harder?
🔵 Ready for production?

Also on the hunt for code starting points: drop links if you’ve got them! 💡
#dataviz #svelte
curiousdata.bsky.social
+1. went to Chicago last year, will attend Miami virtually this year.
curiousdata.bsky.social
Last year, there were talks of viewing parties for people who could not attend in person, I believe? It could be cool to organise one in Europe?
Disclaimer: not throwing my hat in the ring to organise, just wondering if that's something @datavizsociety.bsky.social or someone is working on?
curiousdata.bsky.social
Wow, I had to check this was a real article and not a spoof.
Using biased data visualization to push a narrative is like using phrenology to justify beliefs—it looks 'scientific' on the surface but falls apart under scrutiny.
curiousdata.bsky.social
Signal boosting this 🧵. Whether you are a #dataviz professional or amateur, journalist or working in a corporate setting, it's all the same: don't ignore your responsibilities and ethics. Especially now.
chezvoila.com
Once again, the New York Times gives the dataviz community an opportunity to reflect on its purpose.

Can everything be quantified and turned into a chart?

Most important: what are the consequences of a chart?

If words matter, charts matter too.
polphilpod.bsky.social
Of course the NYT sees the "DEI" stuff positively & is neutral on anti-trans discrimination
curiousdata.bsky.social
Went to Chicago last year, but can't justify to myself the expense nor the carbon footprint two years in a row. And yeah, unwilling to visit the country right now.
Reposted by Anne-Sophie Pereira De Sá
moritzstefaner.bsky.social
"…there’s one nut we have not been able to crack: anchoring bespoke data visualization as a full fledged profession in corporate settings."

Re-reading this article from 2017 (medium.com/visualizing-...), I wonder — where are we at 8 years on?
There be dragons: dataviz in the industry
I started being serious about data visualization around 2005, when the field was still pretty niche and people like Martin Wattenberg, Ben…
medium.com
curiousdata.bsky.social
I totally get that. My challenge is this impression that "well, if that's to build bar charts, we don't need a data person" and I'm trying to explain my contribution could be a bit more than that :)
curiousdata.bsky.social
very valid points, thank you for sharing!
curiousdata.bsky.social
🎵 They manipulate and threaten
With terror as a weapon
Scare you till you're stupefied
Wear you down until you're on their side 🎵
(Where’s the Revolution)
manmademoon.bsky.social
Don't worry, everyone. I've come up with a solution...
curiousdata.bsky.social
#Dataviz pros, I’d love your insights! 💡 Speaking to a corporate audience (incl. graphic designers) about the value of a data viz professional 📊 vs. a graphic designer 🎨.
How do you explain what sets us apart while showing how we complement each other? Keen to hear your take! #DataVisualization
two men are sitting next to each other and one of them is saying teamwork
ALT: two men are sitting next to each other and one of them is saying teamwork
media.tenor.com
Reposted by Anne-Sophie Pereira De Sá
khoavuumn.bsky.social
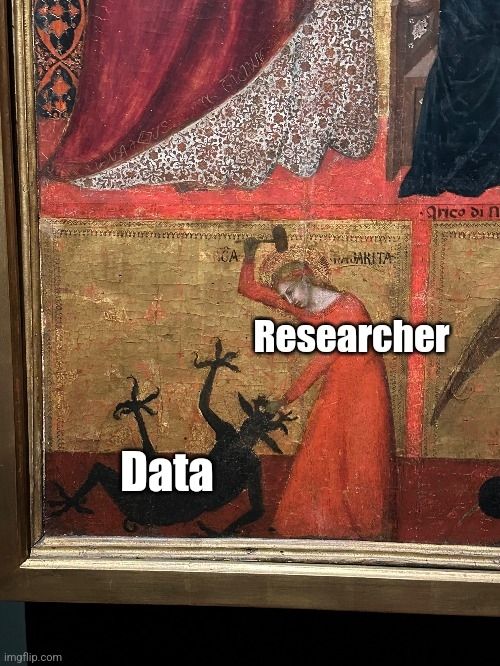
Researcher: "We let the data speak for itself."

Earlier that day:
Reposted by Anne-Sophie Pereira De Sá
lucystats.bsky.social
a bit more #Severance data
please enjoy all analyses equally

👉 lucymcgowan.github.io/mdr-website/

and for my #rstats friends:
👉 lucymcgowan.github.io/mdr/