Danilo Leandro Trisi
@danilotrisi.bsky.social
120 followers 150 following 20 posts
I research poverty, equity & social policy. Dad. PhD. Data nerd. Data/research consultant. Affiliate Scholar @centeronbudget.bsky.social & @georgetownpoverty.bsky.social
Posts Media Videos Starter Packs
Pinned
danilotrisi.bsky.social
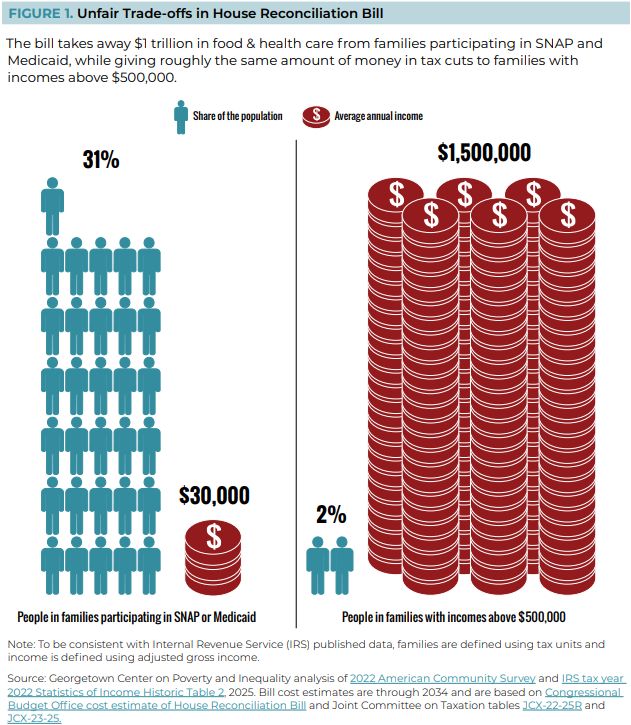
In a new @GtownLawPovCntr analysis, we ran the numbers to reveal the unfair tradeoffs in the "big, beautiful bill" which takes health care & food away from the many to pay for tax cuts for the few.

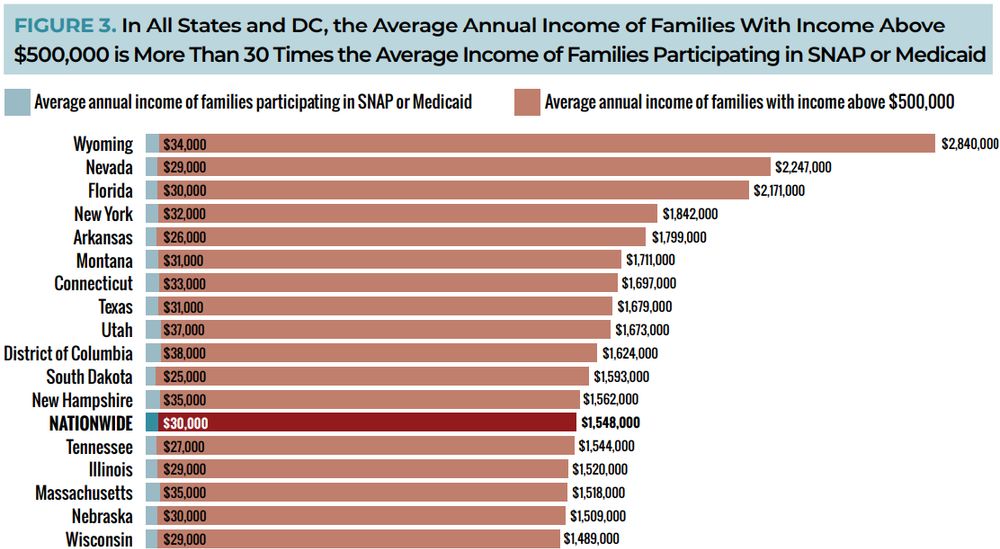
We also ran numbers by state. The results are staggering.
www.georgetownpoverty.org/issues/food-...
danilotrisi.bsky.social
Instead of enacting policies that would reduce poverty & hardship, this President and the Republican majority in congress have pushed the megabill and other policies that weaken programs Census data show lifted millions out of poverty in 2024.
www.cbpp.org/blog/analyzi...
danilotrisi.bsky.social
The #ChildTaxCredit lifted 2.4 million children out of poverty in 2024, but making a $2,200 credit fully refundable could have lifted 1.4 million more children, an opportunity Congress and President Trump missed. www.cbpp.org/blog/analyzi...
danilotrisi.bsky.social
New Census data show that child poverty remained much higher in 2024 than in 2021, when the #ChildTaxCredit expansion & other pandemic relief sharply lowered poverty & reduced racial inequities.

Biggest Takeaway: policies matter & poverty is a policy choice!
www.cbpp.org/blog/analyzi...
danilotrisi.bsky.social
In our analysis of the House bill, we showed how people in families with income above $500,000 have average annual incomes of $1.5 million. This bill will make our debt soar & increase inequality in every state. There's nothing beautiful about that. www.georgetownpoverty.org/issues/food-...
danilotrisi.bsky.social
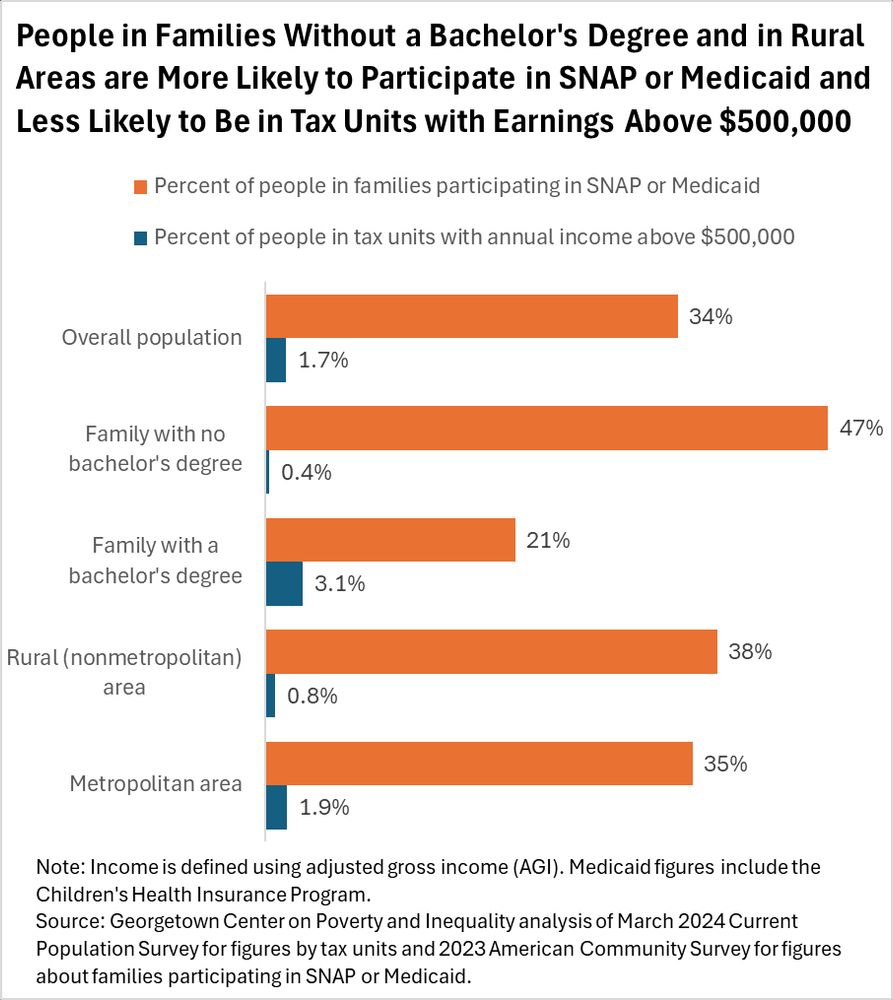
The big winners of the #BigUglyBill will be the small percentage of people who make over $500,000 per year, while millions will lose health care & food assistance. It's striking that this is particularly true even for some groups that disproportionately voted for Trump:
danilotrisi.bsky.social
The numbers don’t lie. The Senate just passed a bill that takes health care & food away from the many to pay for tax cuts for the few.

These unfair trade-offs in the Senate bill are just as bad as they were in the House bill. (And it makes our debt soar!!)
www.georgetownpoverty.org/issues/food-...
danilotrisi.bsky.social
See our paper for full methodology. We used the Census Bureau’s ACS & the latest available published tables from the IRS, which are for tax year 2022. To be consistent with the IRS data, families are defined using tax units and income is defined using adjusted gross income.
danilotrisi.bsky.social
The House bill will exacerbate already extreme levels of income inequality.

In Wyoming, Nevada, and Florida, the average annual income of families above $500,000 is more than 70 times the average income of families participating in SNAP or Medicaid.
docs.google.com/spreadsheets...
danilotrisi.bsky.social
Some of the figures by state show even larger disparities.

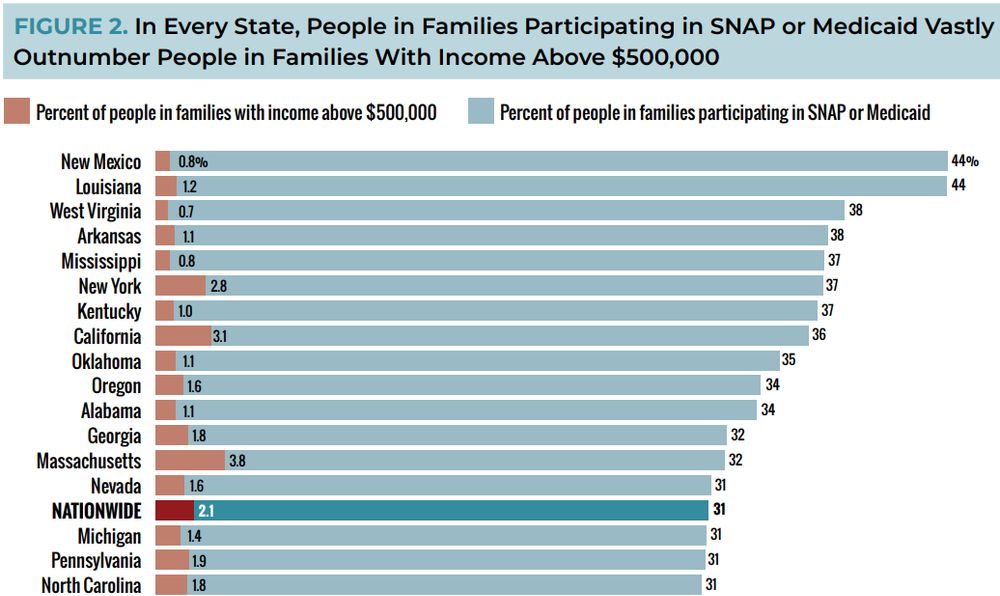
In West Virginia, 38% of people live in families participating in SNAP or Medicaid while less than 1% of people live in families with incomes above $500,000.

Go here for data for all states: docs.google.com/spreadsheets...
danilotrisi.bsky.social
Given these data, it's shocking how the House bill cuts #SNAP & #Medicaid by more than $1 trillion, while giving roughly the same amount of money in tax cuts to families above $500,000.

With average annual incomes of $1.5 million, do these families really need another round of tax cuts?
danilotrisi.bsky.social
Nationwide, 31% of people live in families participating in #SNAP or #Medicaid earning an average $30,000 a year.

Meanwhile, only 2% of people live in families with income above $500,000, with average annual incomes of $1.5 million.
danilotrisi.bsky.social
In a new @GtownLawPovCntr analysis, we ran the numbers to reveal the unfair tradeoffs in the "big, beautiful bill" which takes health care & food away from the many to pay for tax cuts for the few.

We also ran numbers by state. The results are staggering.
www.georgetownpoverty.org/issues/food-...
Reposted by Danilo Leandro Trisi
wesleytharpe.bsky.social
New report: about $1 in every $3 of state spending comes from federal funds, & that longstanding support is vital to families, communities, & state economies nationwide. Emerging Trump & congressional GOP proposals could threaten broad swaths of it very soon. Here’s how (🧵):
centeronbudget.bsky.social
Emerging Republican federal budget proposals could cut funding for essential services, forcing states to pay more or reduce health care, education, and food aid—harming millions and straining local budgets. www.cbpp.org/research/sta...
A pie chart showing that federal funds comprise about a third of states' annual spending.
Reposted by Danilo Leandro Trisi
chloeneast.bsky.social
Immigration folks -- what are the best sources out there for tracking arrests/deportations in as close to real-time as possible? Thanks!
Reposted by Danilo Leandro Trisi
shelbytgonzales.bsky.social
Though ending birthright citizenship has been previewed in Project 2025 and remarks by President Trump ahead of inauguration, it’s still astonishing to see the new Administration take aim at babies born in our nation through this unconstitutional policy.
danilotrisi.bsky.social
Economic & health security policies are stronger today than in ‘79, though many still struggle to afford the basics. Recent proposals that would take health coverage & food assistance away from people would increase hardship and reverse this progress. www.cbpp.org/research/fed...
Federal Policy Debates in 2025 Carry High Stakes | Center on Budget and Policy Priorities
The decisions that policymakers make could leave many millions of people much worse off while extending and increasing tax breaks for wealthy households.
www.cbpp.org
danilotrisi.bsky.social
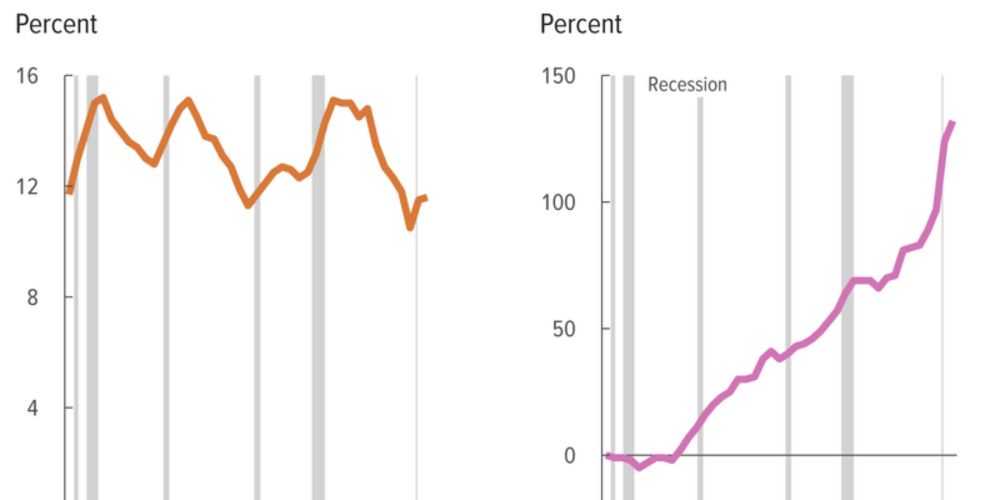
Looking at families in poverty using the official poverty measure in 2019 (before the pandemic), CBO data show that 68% of their total income including non-cash and tax benefits but excluding health benefits comes from “money income,” which is primarily earnings.
danilotrisi.bsky.social
Comparing to the late 1970s when far fewer people were covered by Medicaid and overall health costs were lower, CBO itself warns that the rising costs of #Medicaid and #Medicare “should not be interpreted” as a rise in families’ ability “to meet their basic needs.”
danilotrisi.bsky.social
Second, even in 2021, that 25% figure treats all #Medicaid & #Medicare costs like cash income to families – and acts as though the high medical costs of a subgroup of people with low-income reflects increased purchasing power for most low-income people.
danilotrisi.bsky.social
Some are pointing to data for 2021 from CBO to claim that the share of income of families in poverty that comes from work “dropped to an all-time low of around 25%,” seemingly signaling “a dramatic increase in dependency.” Here’s why that’s misleading. waysandmeans.house.gov/2025/01/08/n...
New Report Shows More Americans Dependent on Welfare Checks, at the Expense of Work – Ways and Means
waysandmeans.house.gov
danilotrisi.bsky.social
Contrary to some claims, most recipients of need-based govt assistance either aren’t expected to work — such as children, the elderly & people with disabilities — or are in working families. Assistance supplements low wages & helps make ends meet during periods of unemployment.
danilotrisi.bsky.social
A new CBO report comparing several measures of income and poverty underscores that government assistance programs have done a lot of good since 1979. Unfortunately, some readers have misconstrued the findings. Let’s take a look.