
David Lam
@davidalam.bsky.social
430 followers
260 following
17 posts
Development economist and economic demographer, University of Michigan.
Posts
Media
Videos
Starter Packs
Reposted by David Lam


David Lam
@davidalam.bsky.social
· Jan 24
<em>Population and Development Review</em> | Population Council Journal | Wiley Online Library
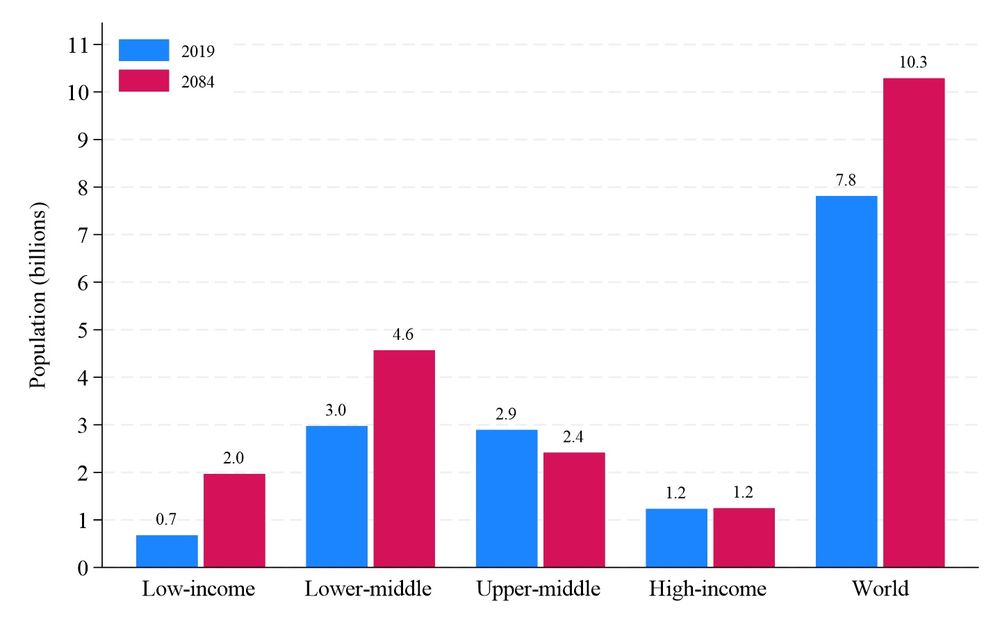
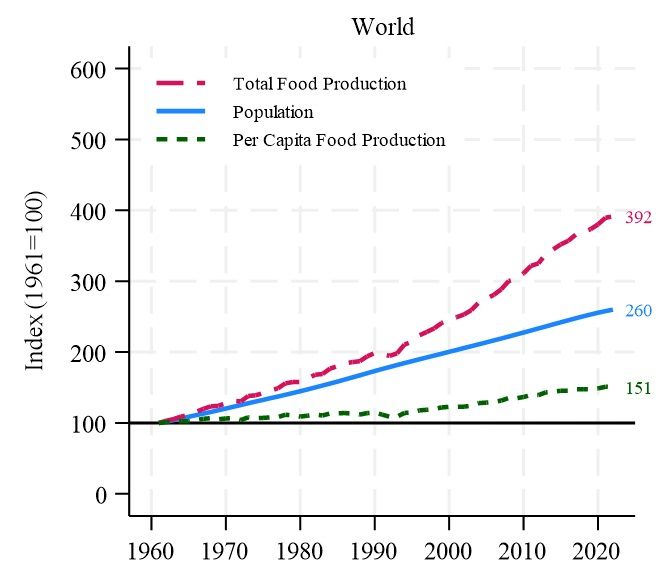
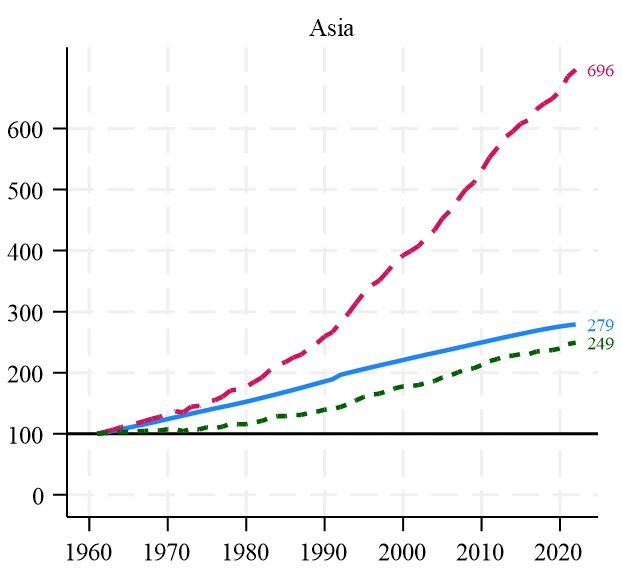
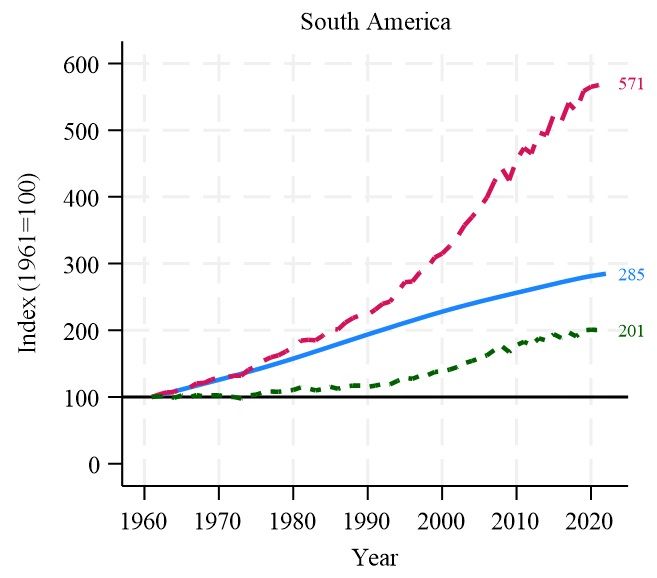
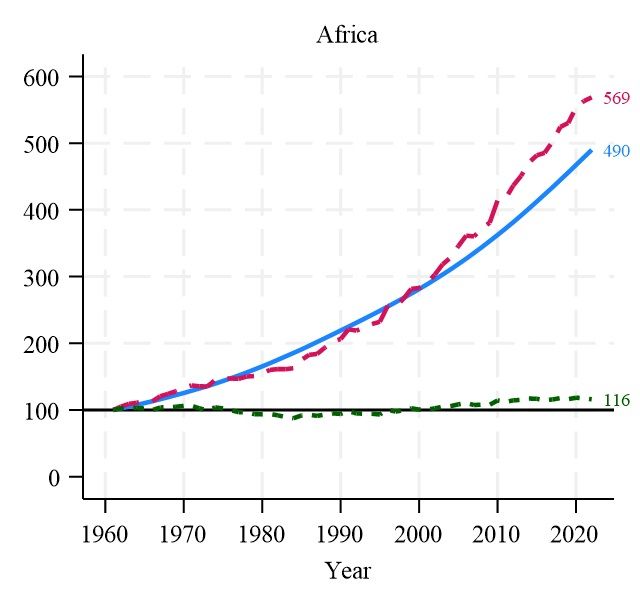
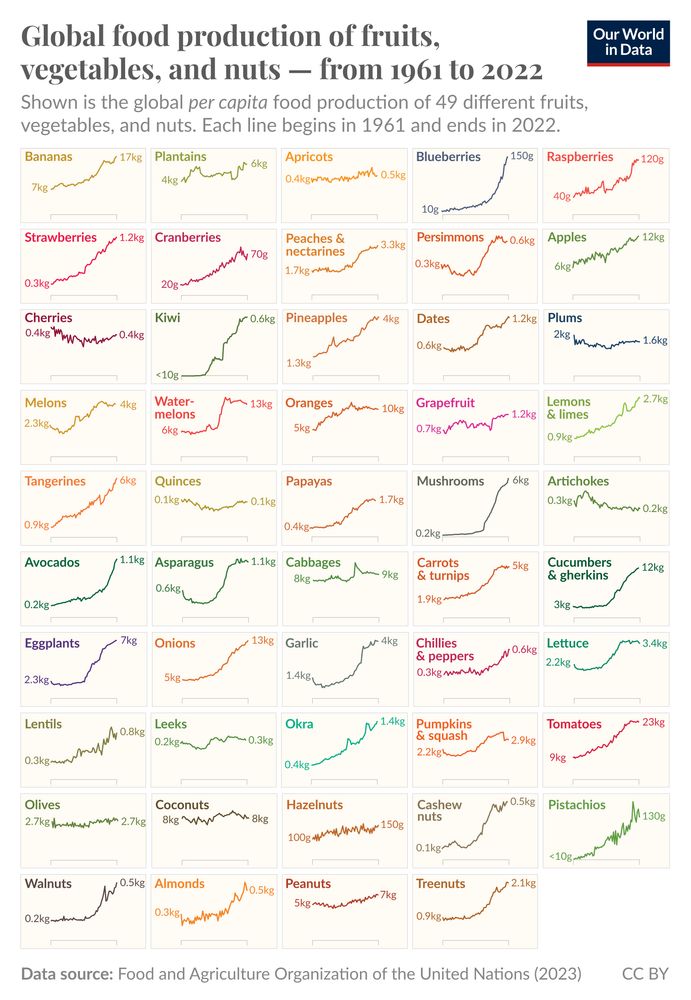
The UN projects that world population will peak at 10.3 billion in 2084, a 2.1 billion increase from 2024. Can the world provide food, water, and other resources to 10.3 billion people? How will addi...
doi.org
David Lam
@davidalam.bsky.social
· Jan 24
David Lam
@davidalam.bsky.social
· Jan 24
David Lam
@davidalam.bsky.social
· Jan 24
David Lam
@davidalam.bsky.social
· Jan 24
David Lam
@davidalam.bsky.social
· Jan 24
David Lam
@davidalam.bsky.social
· Jan 24
David Lam
@davidalam.bsky.social
· Jan 24
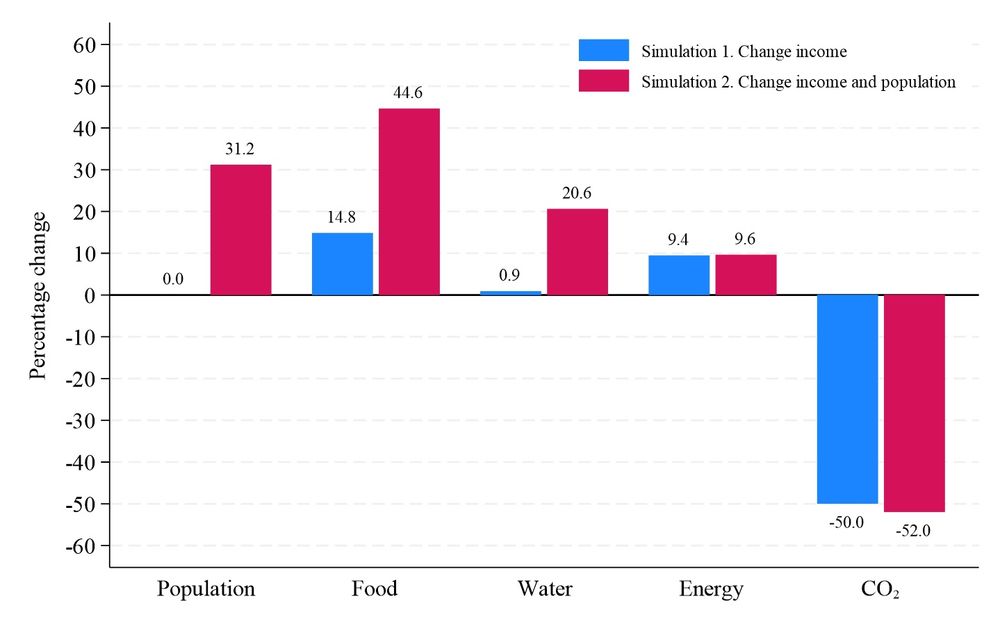
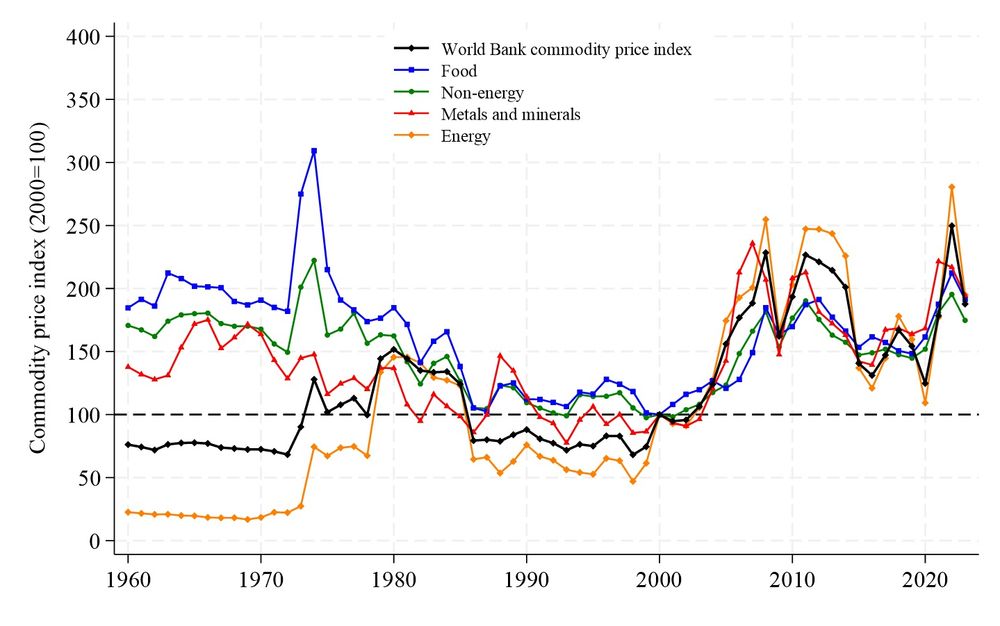
How will two billion more people affect food, water, energy, and CO2? - N-IUSSP
David Lam looks at the resource impact of the projected 2.1 billion increase in world population by 2084. He concludes that population change will increase demand for food and water, ... Read more
www.niussp.org
David Lam
@davidalam.bsky.social
· Jan 24
David Lam
@davidalam.bsky.social
· Jan 24
David Lam
@davidalam.bsky.social
· Jan 24
<em>Population and Development Review</em> | Population Council Journal | Wiley Online Library
The UN projects that world population will peak at 10.3 billion in 2084, a 2.1 billion increase from 2024. Can the world provide food, water, and other resources to 10.3 billion people? How will addi...
doi.org


Reposted by David Lam


Reposted by David Lam

Reposted by David Lam

Reposted by David Lam