Daniel
@dergenaue.bsky.social
6 followers 24 following 15 posts
Posts Media Videos Starter Packs
dergenaue.bsky.social
I also analyzed data from 2023 and 2024 for comparison.
The 2024 drop in subsidies seems to disproportionally have hit the low price segment.
The high price segment is much more electric now than 2y ago.
Plug-Ins have risen, the number of electric models has increased a lot

bsky.app/profile/derg...
dergenaue.bsky.social
Hier noch aus den vergangenen Jahren je einen Monat zum Vergleich.
(aber ungenaue Preisdaten plus fehlende Rabatte)
Man kann deutlich die inzwischen größere E-Modellvielfalt erkennen und dass 2024 insbesondere die günstigen Modelle vom Einbruch betroffen waren.
Und Plug-Ins sind sehr hochgegangen.
dergenaue.bsky.social
I did an analysis in the last days btw on how the EV sales share in Germany spreads over car prices (in German though)

In short: cheap cars not yet highly electrified, 50-60k list price is peak electrification, the higher the price, the more plug-in vehicles

bsky.app/profile/derg...
dergenaue.bsky.social
Mich hat interessiert, wie sich der Anteil von E-Autos an den Neuzulassungen eigentlich abhängig vom Listenpreis verhält.

Interaktive Version hier: www.datawrapper.de/_/PSqha/
Plot, der die Antriebsarten der Neuzulassungen der PKW im August in Deutschland gegen den Listenpreis der Autos vergleicht für Verbrenner, Plug-In Hybride und Batteriefahrzeuge.
Unter 35k dominieren Verbrenner sehr stark.
Über 60k werden allgemein deutlich weniger Autos verkauft.
Batteriefahrzeuge gibt es von 15k (wenig, 10% Anteil) über 55k (30% Anteil), über 75k (15% Anteil) in allen Preisbereichen.
Plug-In Hybride beginnen erst bei 40k mit geringem Anteil, überholen ab 65k die E-Autos (30% Anteil) und steigen bei 80k auf 45% Anteil.
Im Plot sind die einzelnen Modelle als Kreise mit Größe der Zulassungszahlen eingetragen, wodurch besonders viel zugelassene Modelle, wie der Verbrenner VW T-Roc oder der VW ID.3 (beide ~45k) besonders sichtbar werden.
Der Gesamtschnitt der Batterieautos an den Neuzulassungen im August war 19%. Detailansicht des gleichen Plots für 15-75k
dergenaue.bsky.social
Spannende Erkenntnisse:

➡️ In welchen Preisspannen die meisten Verbrenner & E-Autos verkauft werden
➡️ Plug-In Hybrid Anteil steigt mit dem Preis erstaunlich linear
➡️ E-Autos sind anteilig besonders stark im Bereich 50-60k (fast 30%)
➡️ Unter 35k gibt es nur BEVs, ab 70k übernehmen die Plug-In
dergenaue.bsky.social
Mich hat interessiert, wie sich der Anteil von E-Autos an den Neuzulassungen eigentlich abhängig vom Listenpreis verhält.

Interaktive Version hier: www.datawrapper.de/_/PSqha/
Plot, der die Antriebsarten der Neuzulassungen der PKW im August in Deutschland gegen den Listenpreis der Autos vergleicht für Verbrenner, Plug-In Hybride und Batteriefahrzeuge.
Unter 35k dominieren Verbrenner sehr stark.
Über 60k werden allgemein deutlich weniger Autos verkauft.
Batteriefahrzeuge gibt es von 15k (wenig, 10% Anteil) über 55k (30% Anteil), über 75k (15% Anteil) in allen Preisbereichen.
Plug-In Hybride beginnen erst bei 40k mit geringem Anteil, überholen ab 65k die E-Autos (30% Anteil) und steigen bei 80k auf 45% Anteil.
Im Plot sind die einzelnen Modelle als Kreise mit Größe der Zulassungszahlen eingetragen, wodurch besonders viel zugelassene Modelle, wie der Verbrenner VW T-Roc oder der VW ID.3 (beide ~45k) besonders sichtbar werden.
Der Gesamtschnitt der Batterieautos an den Neuzulassungen im August war 19%. Detailansicht des gleichen Plots für 15-75k
dergenaue.bsky.social
Warum ist mein Cursor weg, wenn ich einen Beitrag öffne :(
dergenaue.bsky.social
Imo, new battery chemistries and technologies are just a means to the continuation of the battery learning curve.
Whether and which of them will come won't really make a difference to the overall trajectory
dergenaue.bsky.social
I'm sorry, I guess 😅😂
dergenaue.bsky.social
Very cool data.
Super interesting that numbers on battery swapping vs non-swapping are available.
Reposted by Daniel
robbieandrew.bsky.social
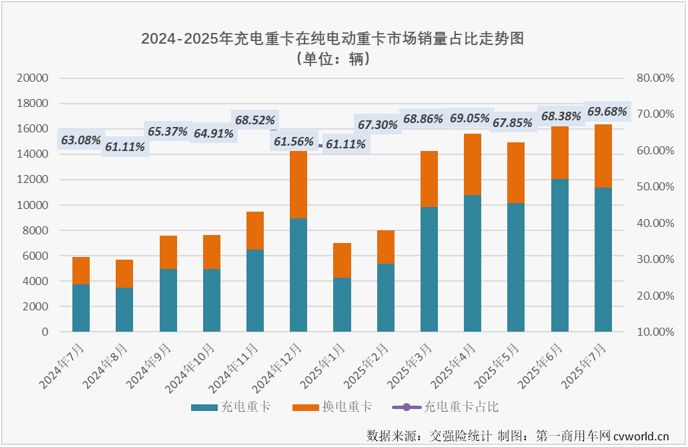
60%-70% of new pure-electric heavy trucks sold in China in the last year were rechargeable, and 30%-40% were battery-swappers.
www.cvworld.cn/news/Onedata...
Graph showing: 2024-2025 Trend Chart of the Sales Share of Charging Heavy-Duty Trucks in the Pure Electric Heavy-Duty Truck Market
dergenaue.bsky.social
What a great topic to collect numbers on :D
But that is truly astonishing actually
dergenaue.bsky.social
The cool part is that the duck curve has already been solved in California thanks to batteries!

And this will also happen across the globe in the coming years
dergenaue.bsky.social
Yes, exactly!
That is what makes them so cool.
And because efficiency for heat pumps (Heat output / Electricity in) is highly dependent on the temperature difference between eg. inside & outside, AC is more efficient than heating.
(Because with AC we typically only want to cool a couple degrees)
dergenaue.bsky.social
??
No?
Heat pumps literally in practical situations have 300% (COP) efficiency when heating and 500% when cooling?
dergenaue.bsky.social
I really don't like the cut-off y-axis in the Graph😅

But in general this is one of the most hope-making outlooks in these times...
Reposted by Daniel
hankgreen.bsky.social
What a horror show to have put that man in charge of anything. The documentary is very short and very good. You can watch it here: www.youtube.com/watch?v=ybVZ...
Defeating a Virus That Killed Half a Billion People – The Plea
YouTube video by Neil Halloran
www.youtube.com
Reposted by Daniel
laurimyllyvirta.bsky.social
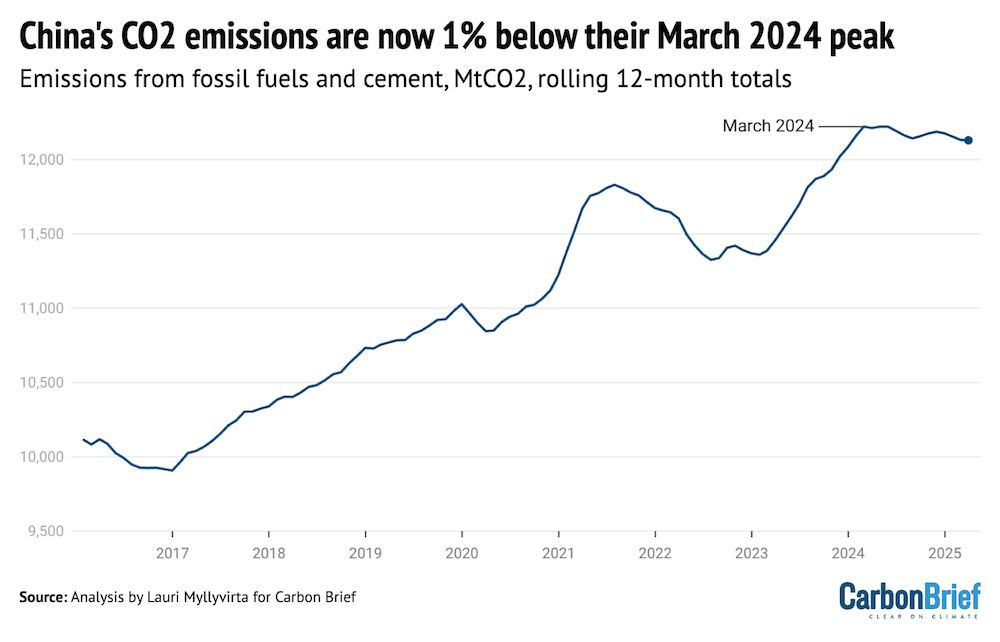
NEW from me: China's CO2 emissions fell ~1.6% in the first quarter and have now been flat or down for more than a year. This is the first time on record that emissions are falling due to clean energy growth, not slow power demand.
carbonbrief.org
NEW – Analysis: Clean energy just put China’s CO2 emissions into reverse for first time | @laurimyllyvirta.bsky.social

Read here: buff.ly/6eAcjRU
Line chart – China's CO2 emissions are now 1% below their March 2024 peak: China’s emissions from fossil fuels and cement, million tonnes of CO2, rolling 12-month totals. Source: Emissions are estimated from National Bureau of Statistics data on production of different fuels and cement, China Customs data on imports and exports and WIND Information data on changes in inventories, applying emissions factors from China’s latest national greenhouse gas emissions inventory and annual emissions factors per tonne of cement production until 2024. Sector breakdown of coal consumption is estimated using coal consumption data from WIND Information and electricity data from the National Energy Administration.