


Ed Hawkins
@edhawkins.org
Climate scientist at the National Centre for Atmospheric Science, University of Reading | IPCC AR6 Lead Author | MBE | Views own | https://edhawkins.org
Warming Stripes: http://www.ShowYourStripes.info
Warming Stripes: http://www.ShowYourStripes.info
Which option do we choose - act or delay?
These are the 'warning' stripes highlighting global choices. Do we act rapidly and keep global temperatures below 2°C, or delay and end up in a 3°C world (or worse)?
These are the 'warning' stripes highlighting global choices. Do we act rapidly and keep global temperatures below 2°C, or delay and end up in a 3°C world (or worse)?

January 15, 2026 at 9:23 AM
Which option do we choose - act or delay?
These are the 'warning' stripes highlighting global choices. Do we act rapidly and keep global temperatures below 2°C, or delay and end up in a 3°C world (or worse)?
These are the 'warning' stripes highlighting global choices. Do we act rapidly and keep global temperatures below 2°C, or delay and end up in a 3°C world (or worse)?
176 tiny maps (1850-2025)
Maps of temperature anomalies for each year. The progression to warmer, redder colours is evident over virtually the entire planet.
This 'small multiples' #dataviz approach is effective to show that nowhere is escaping from the warming due to us burning fossil fuels.
Maps of temperature anomalies for each year. The progression to warmer, redder colours is evident over virtually the entire planet.
This 'small multiples' #dataviz approach is effective to show that nowhere is escaping from the warming due to us burning fossil fuels.

January 14, 2026 at 12:11 PM
176 tiny maps (1850-2025)
Maps of temperature anomalies for each year. The progression to warmer, redder colours is evident over virtually the entire planet.
This 'small multiples' #dataviz approach is effective to show that nowhere is escaping from the warming due to us burning fossil fuels.
Maps of temperature anomalies for each year. The progression to warmer, redder colours is evident over virtually the entire planet.
This 'small multiples' #dataviz approach is effective to show that nowhere is escaping from the warming due to us burning fossil fuels.
Spiralling global temperatures (1850-2025)
The last 3 years really jump out, rather like 2015-6 did when we first produced this graphic back then. Now, 2015-6 looks rather cool...
More on the spiral: doi.org/10.1175/BAMS...
The last 3 years really jump out, rather like 2015-6 did when we first produced this graphic back then. Now, 2015-6 looks rather cool...
More on the spiral: doi.org/10.1175/BAMS...
January 14, 2026 at 11:37 AM
Spiralling global temperatures (1850-2025)
The last 3 years really jump out, rather like 2015-6 did when we first produced this graphic back then. Now, 2015-6 looks rather cool...
More on the spiral: doi.org/10.1175/BAMS...
The last 3 years really jump out, rather like 2015-6 did when we first produced this graphic back then. Now, 2015-6 looks rather cool...
More on the spiral: doi.org/10.1175/BAMS...
As the climate data for 2025 continues to be released, it's time to update various data visualisations.
First - the global climate stripes for 1850-2025. A third darkest red stripe is added.
The last 11 years have been the warmest 11 years on record. A sequence that is unlikely to be broken soon.
First - the global climate stripes for 1850-2025. A third darkest red stripe is added.
The last 11 years have been the warmest 11 years on record. A sequence that is unlikely to be broken soon.


January 14, 2026 at 11:02 AM
As the climate data for 2025 continues to be released, it's time to update various data visualisations.
First - the global climate stripes for 1850-2025. A third darkest red stripe is added.
The last 11 years have been the warmest 11 years on record. A sequence that is unlikely to be broken soon.
First - the global climate stripes for 1850-2025. A third darkest red stripe is added.
The last 11 years have been the warmest 11 years on record. A sequence that is unlikely to be broken soon.
In 2025 Utah and Nevada both broke their annual average temperature records. For Utah, the previous record was from the extreme dust bowl year of 1934.


January 13, 2026 at 10:21 PM
In 2025 Utah and Nevada both broke their annual average temperature records. For Utah, the previous record was from the extreme dust bowl year of 1934.


January 13, 2026 at 10:17 PM
For example, follow Storm Goretti’s forecast track, arriving over southern UK tomorrow evening…

January 7, 2026 at 3:35 PM
For example, follow Storm Goretti’s forecast track, arriving over southern UK tomorrow evening…
Published today: Importance of beginning industrial-era climate simulations in the eighteenth century
Defining pre-industrial to be 1750, rather than 1850, produces different (simulated) historical climate changes after 1850. Pre-1850 volcanoes & land use matter.
iopscience.iop.org/article/10.1...
Defining pre-industrial to be 1750, rather than 1850, produces different (simulated) historical climate changes after 1850. Pre-1850 volcanoes & land use matter.
iopscience.iop.org/article/10.1...

January 6, 2026 at 4:30 PM
Published today: Importance of beginning industrial-era climate simulations in the eighteenth century
Defining pre-industrial to be 1750, rather than 1850, produces different (simulated) historical climate changes after 1850. Pre-1850 volcanoes & land use matter.
iopscience.iop.org/article/10.1...
Defining pre-industrial to be 1750, rather than 1850, produces different (simulated) historical climate changes after 1850. Pre-1850 volcanoes & land use matter.
iopscience.iop.org/article/10.1...
What would the hottest UK day of 1976 look like today?
35.9°C back in 1976 would be 38-39°C now.
The hot extremes are warming faster than the average for the UK.
climatelabbook.substack.com/p/the-summer...
35.9°C back in 1976 would be 38-39°C now.
The hot extremes are warming faster than the average for the UK.
climatelabbook.substack.com/p/the-summer...

January 6, 2026 at 3:00 PM
What would the hottest UK day of 1976 look like today?
35.9°C back in 1976 would be 38-39°C now.
The hot extremes are warming faster than the average for the UK.
climatelabbook.substack.com/p/the-summer...
35.9°C back in 1976 would be 38-39°C now.
The hot extremes are warming faster than the average for the UK.
climatelabbook.substack.com/p/the-summer...
Putting the hot & dry summer of 1976 into context
50 years after the extreme summer for the UK and Ireland, what can we still learn?
climatelabbook.substack.com/p/the-summer...
50 years after the extreme summer for the UK and Ireland, what can we still learn?
climatelabbook.substack.com/p/the-summer...

January 6, 2026 at 8:56 AM
Putting the hot & dry summer of 1976 into context
50 years after the extreme summer for the UK and Ireland, what can we still learn?
climatelabbook.substack.com/p/the-summer...
50 years after the extreme summer for the UK and Ireland, what can we still learn?
climatelabbook.substack.com/p/the-summer...
It has been fascinating to watch recently. This one was between Christmas and New Year - @roostweather.bsky.social explained to me that the two warm sites were at high elevation above the inversion with cold sites in the valleys.

January 4, 2026 at 8:07 PM
It has been fascinating to watch recently. This one was between Christmas and New Year - @roostweather.bsky.social explained to me that the two warm sites were at high elevation above the inversion with cold sites in the valleys.
2025 also set records for the amount of UK electricity produced by renewable sources (solar and wind).
Fossil gas now makes up 27% of UK’s total electricity generation.
Article with some excellent graphics: www.bbc.co.uk/news/article...
Fossil gas now makes up 27% of UK’s total electricity generation.
Article with some excellent graphics: www.bbc.co.uk/news/article...


January 2, 2026 at 7:30 PM
2025 also set records for the amount of UK electricity produced by renewable sources (solar and wind).
Fossil gas now makes up 27% of UK’s total electricity generation.
Article with some excellent graphics: www.bbc.co.uk/news/article...
Fossil gas now makes up 27% of UK’s total electricity generation.
Article with some excellent graphics: www.bbc.co.uk/news/article...
The UK's warmest year (for now)
And introducing a ‘causal chain’ for changes in extreme UK heat
climatelabbook.substack.com/p/the-uks-wa...
And introducing a ‘causal chain’ for changes in extreme UK heat
climatelabbook.substack.com/p/the-uks-wa...

January 2, 2026 at 12:18 PM
The UK's warmest year (for now)
And introducing a ‘causal chain’ for changes in extreme UK heat
climatelabbook.substack.com/p/the-uks-wa...
And introducing a ‘causal chain’ for changes in extreme UK heat
climatelabbook.substack.com/p/the-uks-wa...
2025 was the warmest year on record for Central England in a dataset that starts in 1659.
(Daily data available since 1772.)
www.metoffice.gov.uk/hadobs/hadce...
(Daily data available since 1772.)
www.metoffice.gov.uk/hadobs/hadce...

January 1, 2026 at 2:56 PM
2025 was the warmest year on record for Central England in a dataset that starts in 1659.
(Daily data available since 1772.)
www.metoffice.gov.uk/hadobs/hadce...
(Daily data available since 1772.)
www.metoffice.gov.uk/hadobs/hadce...
It is likely that 2025 will be the warmest year on record for the UK.
Why does this matter?
Burning fossil fuels is warming the planet, including the UK, causing heatwaves to get hotter. For Central England this is happening 2x faster than the mean change.
www.bbc.co.uk/news/article...
Why does this matter?
Burning fossil fuels is warming the planet, including the UK, causing heatwaves to get hotter. For Central England this is happening 2x faster than the mean change.
www.bbc.co.uk/news/article...

December 23, 2025 at 10:51 AM
It is likely that 2025 will be the warmest year on record for the UK.
Why does this matter?
Burning fossil fuels is warming the planet, including the UK, causing heatwaves to get hotter. For Central England this is happening 2x faster than the mean change.
www.bbc.co.uk/news/article...
Why does this matter?
Burning fossil fuels is warming the planet, including the UK, causing heatwaves to get hotter. For Central England this is happening 2x faster than the mean change.
www.bbc.co.uk/news/article...
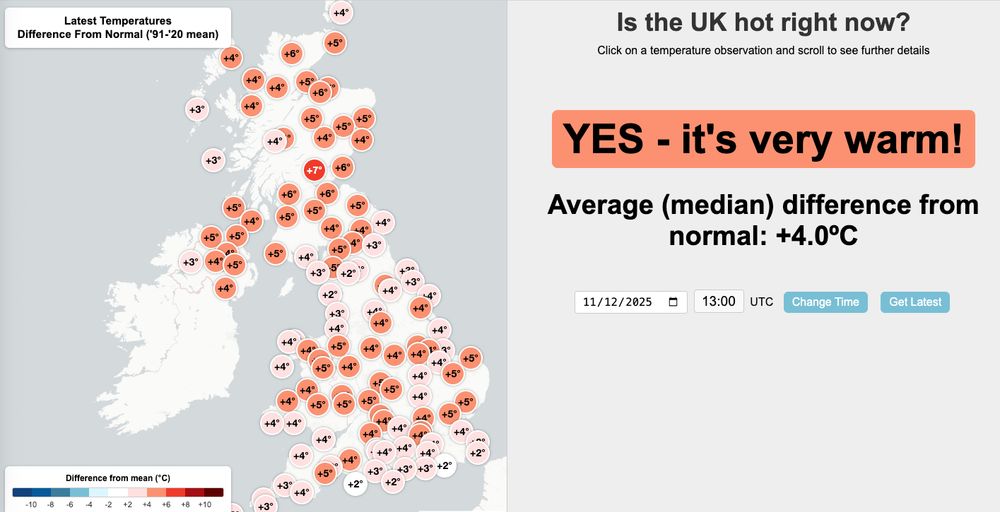
Is it warm in the UK right now?
Yes, it is very warm!
Track temperatures every hour: istheukhotrightnow.com
Yes, it is very warm!
Track temperatures every hour: istheukhotrightnow.com
December 11, 2025 at 2:01 PM
Is it warm in the UK right now?
Yes, it is very warm!
Track temperatures every hour: istheukhotrightnow.com
Yes, it is very warm!
Track temperatures every hour: istheukhotrightnow.com
Why do we want such pressure observations?
On 26th Jan 1884, the UK experienced its lowest ever observed sea level pressure with a windstorm at <930mb over Scotland. We will add these newly rescued observations into a reanalysis system to build a full dynamical reconstruction of this extreme event.
On 26th Jan 1884, the UK experienced its lowest ever observed sea level pressure with a windstorm at <930mb over Scotland. We will add these newly rescued observations into a reanalysis system to build a full dynamical reconstruction of this extreme event.

December 8, 2025 at 8:49 PM
Why do we want such pressure observations?
On 26th Jan 1884, the UK experienced its lowest ever observed sea level pressure with a windstorm at <930mb over Scotland. We will add these newly rescued observations into a reanalysis system to build a full dynamical reconstruction of this extreme event.
On 26th Jan 1884, the UK experienced its lowest ever observed sea level pressure with a windstorm at <930mb over Scotland. We will add these newly rescued observations into a reanalysis system to build a full dynamical reconstruction of this extreme event.
The Google Gemini3 LLM is remarkably excellent at reading weather observations from handwritten logbooks.
Example of recovering hourly pressure observations taken in Oxford in December 1883 and January 1884, compared to human-keyed data from relatively nearby sites.
Climate data rescue solved?
Example of recovering hourly pressure observations taken in Oxford in December 1883 and January 1884, compared to human-keyed data from relatively nearby sites.
Climate data rescue solved?


December 8, 2025 at 11:40 AM
The Google Gemini3 LLM is remarkably excellent at reading weather observations from handwritten logbooks.
Example of recovering hourly pressure observations taken in Oxford in December 1883 and January 1884, compared to human-keyed data from relatively nearby sites.
Climate data rescue solved?
Example of recovering hourly pressure observations taken in Oxford in December 1883 and January 1884, compared to human-keyed data from relatively nearby sites.
Climate data rescue solved?
There are several extreme historical UK & Ireland windstorms which are of interest to insurance companies to understand wind risks, e.g. January 1884 dropped to <930mb over Scotland.
Postdoc position in Reading (working with Aon & QBE) to explore these risks: jobs.reading.ac.uk/Job/JobDetai...
Postdoc position in Reading (working with Aon & QBE) to explore these risks: jobs.reading.ac.uk/Job/JobDetai...

November 25, 2025 at 11:10 AM
There are several extreme historical UK & Ireland windstorms which are of interest to insurance companies to understand wind risks, e.g. January 1884 dropped to <930mb over Scotland.
Postdoc position in Reading (working with Aon & QBE) to explore these risks: jobs.reading.ac.uk/Job/JobDetai...
Postdoc position in Reading (working with Aon & QBE) to explore these risks: jobs.reading.ac.uk/Job/JobDetai...
Climate variations over the last 2000 years provide valuable context and help answer questions about how unusual the recent changes are.
Now with added global sea level rise: climatelabbook.substack.com/p/climate-ch...
Graphics: ed-hawkins.github.io/climate-visu...
Now with added global sea level rise: climatelabbook.substack.com/p/climate-ch...
Graphics: ed-hawkins.github.io/climate-visu...

November 18, 2025 at 2:43 PM
Climate variations over the last 2000 years provide valuable context and help answer questions about how unusual the recent changes are.
Now with added global sea level rise: climatelabbook.substack.com/p/climate-ch...
Graphics: ed-hawkins.github.io/climate-visu...
Now with added global sea level rise: climatelabbook.substack.com/p/climate-ch...
Graphics: ed-hawkins.github.io/climate-visu...
How much carbon budget do we have left if we want to stay below 1.5˚C?
Just 2 more years at current rates. It is essentially impossible to avoid global temperature rise exceeding 1.5˚C.
climatelabbook.substack.com/p/the-shrink...
Just 2 more years at current rates. It is essentially impossible to avoid global temperature rise exceeding 1.5˚C.
climatelabbook.substack.com/p/the-shrink...
November 13, 2025 at 1:19 PM
How much carbon budget do we have left if we want to stay below 1.5˚C?
Just 2 more years at current rates. It is essentially impossible to avoid global temperature rise exceeding 1.5˚C.
climatelabbook.substack.com/p/the-shrink...
Just 2 more years at current rates. It is essentially impossible to avoid global temperature rise exceeding 1.5˚C.
climatelabbook.substack.com/p/the-shrink...
A damaging hurricane in a warmer world
How would a major hurricane that hit Jamaica in 1903 be different today, in a warmer world?
It would drop more rain. (At least)
climatelabbook.substack.com/p/a-damaging...
How would a major hurricane that hit Jamaica in 1903 be different today, in a warmer world?
It would drop more rain. (At least)
climatelabbook.substack.com/p/a-damaging...

November 2, 2025 at 9:21 AM
A damaging hurricane in a warmer world
How would a major hurricane that hit Jamaica in 1903 be different today, in a warmer world?
It would drop more rain. (At least)
climatelabbook.substack.com/p/a-damaging...
How would a major hurricane that hit Jamaica in 1903 be different today, in a warmer world?
It would drop more rain. (At least)
climatelabbook.substack.com/p/a-damaging...
In August 1903 a cat 3 hurricane hit Jamaica causing significant damage.
Our reanalysis-based approach (esd.copernicus.org/articles/14/...) can examine how that storm would be different in a warmer world like today.
Then & now precipitable water fields show heavier rain would be likely.
#Melissa
Our reanalysis-based approach (esd.copernicus.org/articles/14/...) can examine how that storm would be different in a warmer world like today.
Then & now precipitable water fields show heavier rain would be likely.
#Melissa

October 26, 2025 at 8:49 AM
In August 1903 a cat 3 hurricane hit Jamaica causing significant damage.
Our reanalysis-based approach (esd.copernicus.org/articles/14/...) can examine how that storm would be different in a warmer world like today.
Then & now precipitable water fields show heavier rain would be likely.
#Melissa
Our reanalysis-based approach (esd.copernicus.org/articles/14/...) can examine how that storm would be different in a warmer world like today.
Then & now precipitable water fields show heavier rain would be likely.
#Melissa
A request for weather interested volunteers!
Met Eireann would like to rescue millions of weather observations taken in Ireland over many decades that are still stuck on paper. #WeatherRescue
Anyone can help: www.zooniverse.org/projects/met...
Met Eireann would like to rescue millions of weather observations taken in Ireland over many decades that are still stuck on paper. #WeatherRescue
Anyone can help: www.zooniverse.org/projects/met...

October 16, 2025 at 7:25 AM
A request for weather interested volunteers!
Met Eireann would like to rescue millions of weather observations taken in Ireland over many decades that are still stuck on paper. #WeatherRescue
Anyone can help: www.zooniverse.org/projects/met...
Met Eireann would like to rescue millions of weather observations taken in Ireland over many decades that are still stuck on paper. #WeatherRescue
Anyone can help: www.zooniverse.org/projects/met...
UK air temperatures and soil temperatures are warming at the same rate
climatelabbook.substack.com/p/monitoring...
climatelabbook.substack.com/p/monitoring...

October 9, 2025 at 12:17 PM
UK air temperatures and soil temperatures are warming at the same rate
climatelabbook.substack.com/p/monitoring...
climatelabbook.substack.com/p/monitoring...