Eugenio Paglino
@eugeniopaglino.bsky.social
1.8K followers 2.1K following 71 posts
Data Scientist and Postdoc at @pophel.bsky.social. PhD in Demography and Sociology at UPenn, Statistics MA at Wharton. My research focuses on mortality determinants and trends. Bayesian statistics, forecasting, statistical modeling.
Posts Media Videos Starter Packs
eugeniopaglino.bsky.social
🚨🚨 We are hiring 2 postdocs at PopHel – MaxHel. If you are interested in health inequalities and social determinants of health this is a great opportunity! Amazing working environment ✨, unique data infrastructure, and a truly interdisciplinary and international center 🌍. Deadline October 31st.
pophel.bsky.social
🚨Job alert!🚨

Helsinki Institute for Demography and Population Health is recruiting 2 postdocs. Join our team and investigate social inequalities in health!

jobs.helsinki.fi/job/Helsinki...

#postdoc #demography #socialsciences #socialdata
Two Postdoctoral Researchers on Health Inequalities
jobs.helsinki.fi
eugeniopaglino.bsky.social
Had a great experience ⭐ at #SLLS2025! I hope we gave a good overview of what is possible with the amazing Finnish 🇫🇮 register data! @pophel.bsky.social @sllshome.bsky.social
pophel.bsky.social
Our symposium from #SLLS2025 @sllshome.bsky.social consisted of research from Shubh Sharma @eugeniopaglino.bsky.social @olivia-mcevoy.bsky.social mcevoy.bsky.social @moberndorfer.bsky.social orfer.bsky.social Lauren Bishop and registry data expertise from Hanna Remes.
Thanks to all who attended!
Reposted by Eugenio Paglino
jama.com
JAMA @jama.com · Aug 6
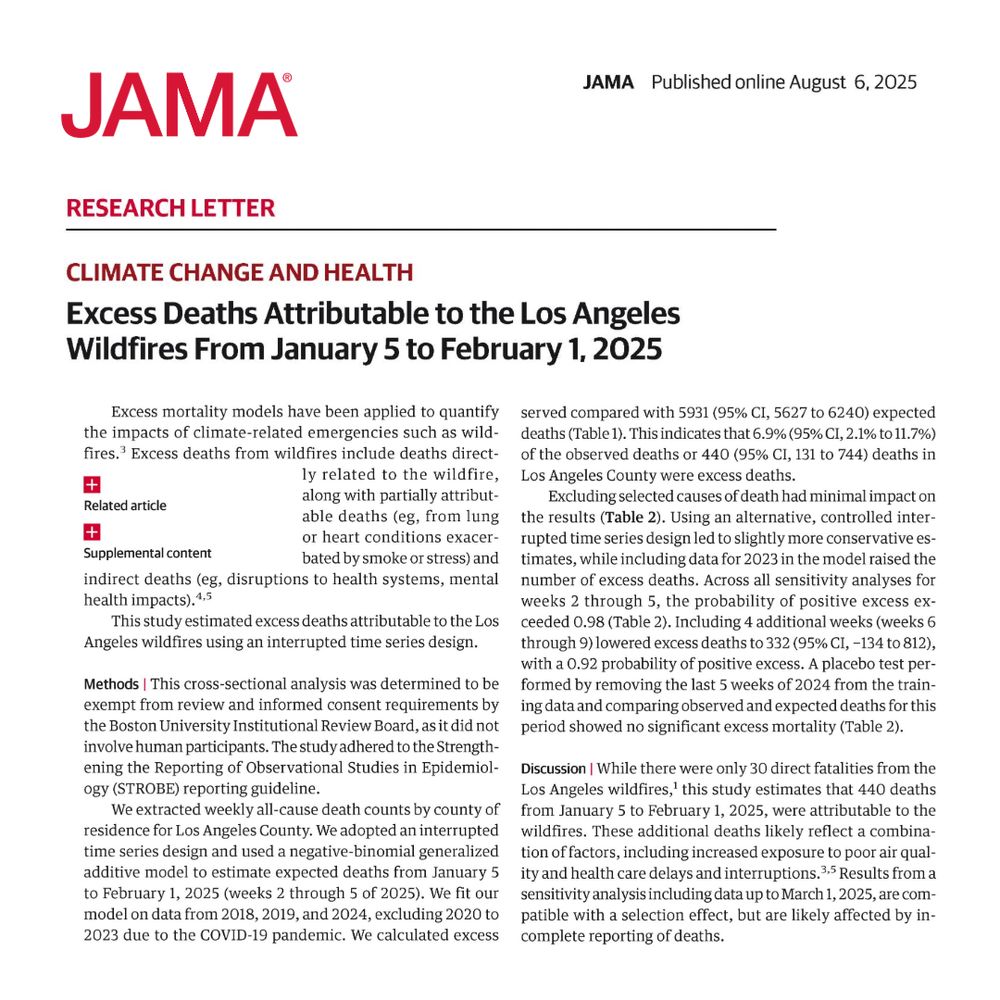
An estimated 440 excess deaths were attributed to the January 2025 wildfires in Los Angeles County, underscoring indirect health effects and the need for improved mortality tracking.

ja.ma/4oFM3af #MedSky
Excess Deaths Attributable to the Los Angeles
Wildfires From January 5 to February 1, 2025
eugeniopaglino.bsky.social
It would be great to see more work 📄 filling these gaps and extending this approach to other events, contributing to improve our understanding of the short- and long-term impacts of different natural disasters on mortality and other health outcomes #publichealth #demography #Demography
eugeniopaglino.bsky.social
While our study is an important first step, we could not look into which groups were more severely affected, e.g. by socioeconomic status or neighbourhood, we only looked at the first 4 weeks, and we only considered mortality rather than including other health outcomes
eugeniopaglino.bsky.social
Demographers could play an important role in this area by leveraging their expertise on mortality data and modeling to make estimates like the ones in our paper available for other natural disasters
eugeniopaglino.bsky.social
The contrast between 30 direct fatalities and >400 excess deaths underscores the importance of complementing cause-of-death investigation (to identify direct deaths) with techniques more suited to capture both direct and indirect mortality impacts of wildfires and other natural disasters
eugeniopaglino.bsky.social
We find that mortality was higher 📈 than expected in the first four weeks after the wildfires (440 more deaths than expected). We performed several sensitivity analyses to rule out other mechanisms
eugeniopaglino.bsky.social
In this work with @astokespop.bsky.social and Rafeya Raquib at @busph.bsky.social , we use mortality models to estimate expected deaths 📈 in the absence of the wildfires. We then compare observed and expected deaths to quantify how many excess deaths ☠️ are likely attributable to the wildfires🔥
eugeniopaglino.bsky.social
But of course future can't explain the past, so if the slowdown appeared much earlier in some state-metro combinations, then other mechanisms have to be responsible 8/8🧵
eugeniopaglino.bsky.social
Beyond demographic curiosity, these findings have implications for how we think about explaining the US mortality stagnation. If 2010 or 2014 are meaningful thresholds then explanations focusing on what happened shortly before (e.g. the Great Recession) seem more plausible 7/8🧵
eugeniopaglino.bsky.social
For example, female mortality showed very little improvement past 2005 in Iowa and Kansas. At the same time, metropolitan counties in California, Texas, and New York show only moderate slowdowns in mortality declines over the entire period 6/8🧵
State-level trends in metropolitan and nonmetropolitan mortality by sex in the United States (1999-2019)
eugeniopaglino.bsky.social
Another interesting finding is that while nationally mortality declines have slowed down starting in 2010, and stagnated after 2014, these are not obvious thresholds at the state-metro level 5/8🧵
eugeniopaglino.bsky.social
Even in the late 2010s, 8 states had lower female and male mortality in nonmetropolitan than metropolitan areas, highlighting that national-level trends and patterns can hide significant heterogeneity 4/8🧵
Deviations of state mortality from the national US average for metropolitan and nonmetropolitan counties by state. The graph shows that although generally metropolitan areas increasingly experienced lower-than-average mortality, nonmetropolitan areas fell behind and experienced higher-than-average mortality. However, at the same time, significant regional variation remains.
eugeniopaglino.bsky.social
While we are accustomed to think of a nonmetropolitan mortality disadvantage, we show that in the early 2000s 19 states for females and 10 for males had lower mortality in nonmetropolitan than in metropolitan areas 3/8🧵
eugeniopaglino.bsky.social
This is a descriptive study (with publicly available data) but I think it shows that deep description of a phenomenon can provide valuable insights even if it does not directly explore explanations for the observed patterns 2/8🧵
eugeniopaglino.bsky.social
Studies like the one by Jacob Bor and colleagues are of great help in quantifying the extent of misreporting and the detailed misclassification ratios they report that can be applied by other teams that do not have access to the restricted ACS-NVSS linked data
eugeniopaglino.bsky.social
Survey data linked with mortality records are great but 1) publicly available data is limited (NHIS, NHANES, some NLMS), 2) sample sizes are small and a lot of spatial and temporal granularity is lost, and 3) linkages with vital statistics are updated with long delays (NHIS now goes to 2019)
eugeniopaglino.bsky.social
We faced a similar problem with the reporting of education on death certificates (and developed an potential solution) but there are few general purpose strategies that would work for all characteristics reported on death certificates jamanetwork.com/journals/jam...
Diverging Mortality Trends by Educational Attainment in the US
This cross-sectional study examines trends in US mortality rates by sex and educational attainment before, during, and after the COVID-19 pandemic.
jamanetwork.com
eugeniopaglino.bsky.social
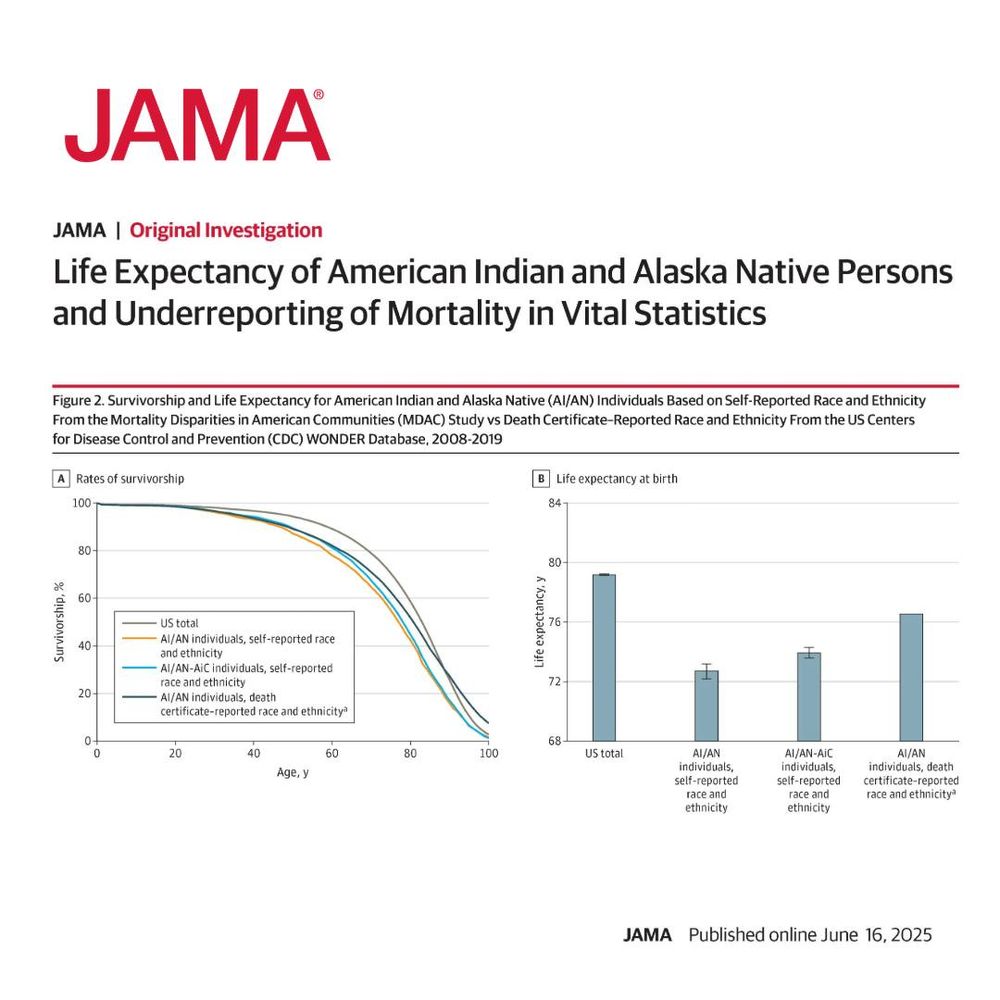
This greatly limits the availability of official mortality statistics for AI/AN populations and is of course a barrier to tackling existing inequalities (since we can't even measure them!)
eugeniopaglino.bsky.social
Very important work by Jacob Bor and colleagues. Poor data quality of demographic and socioeconomic information on death certificates remains a big obstacle to the production of timely mortality statistics disaggregated by more than age, sex, and selected race and Hispanic origin groups.
jamahealthforum.com
From <a href="https://bsky.app/profile/did:plc:q5ogl3twkcqyhvz4zebonw3z" class="hover:underline text-blue-600 dark:text-sky-400" target="_blank" rel="noopener">@jama.com: The life expectancy of American Indian and Alaska Native individuals is underestimated due to racial misclassification on death certificates, according to this longitudinal cohort study.

ja.ma/447kyg5
The life expectancy of American Indian and Alaska Native individuals is underestimated