Kinnary Shah
@kinnaryshah.bsky.social
120 followers
470 following
11 posts
working on my phd @jhubiostat.bsky.social
Posts
Media
Videos
Starter Packs

Kinnary Shah
@kinnaryshah.bsky.social
· Aug 4
Kinnary Shah
@kinnaryshah.bsky.social
· Jul 24

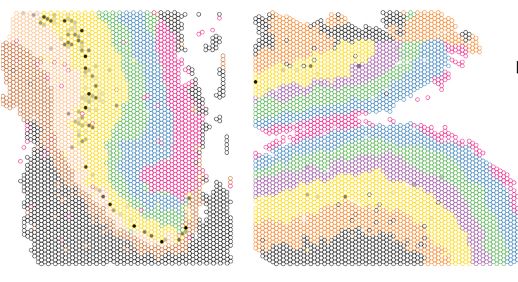
Spatio-molecular gene expression reflects dorsal anterior cingulate cortex structure and function in the human brain
In the human brain, the dorsal anterior cingulate cortex (dACC) plays key roles in various components of cognitive control, and is particularly relevant for reward processing and conflict monitoring. ...
www.biorxiv.org
Kinnary Shah
@kinnaryshah.bsky.social
· Jul 24
Kinnary Shah
@kinnaryshah.bsky.social
· Jun 24
Kinnary Shah
@kinnaryshah.bsky.social
· Jun 17
Reposted by Kinnary Shah


Reposted by Kinnary Shah

Kinnary Shah
@kinnaryshah.bsky.social
· Nov 17
Kinnary Shah
@kinnaryshah.bsky.social
· Nov 17
Kinnary Shah
@kinnaryshah.bsky.social
· Nov 17
Kinnary Shah
@kinnaryshah.bsky.social
· Nov 16