LSHTM TB Modelling Group
@lshtm-tbmod.bsky.social
200 followers
120 following
6 posts
Updates from the TB Modelling Group, a multidisciplinary group of mathematical modellers, economists, and epidemiologists from LSHTM
Posts
Media
Videos
Starter Packs
Reposted by LSHTM TB Modelling Group

Reposted by LSHTM TB Modelling Group

Reposted by LSHTM TB Modelling Group


Reposted by LSHTM TB Modelling Group

Reposted by LSHTM TB Modelling Group

Reposted by LSHTM TB Modelling Group
Reposted by LSHTM TB Modelling Group

Katherine Horton
@kchorton.bsky.social
· Aug 27

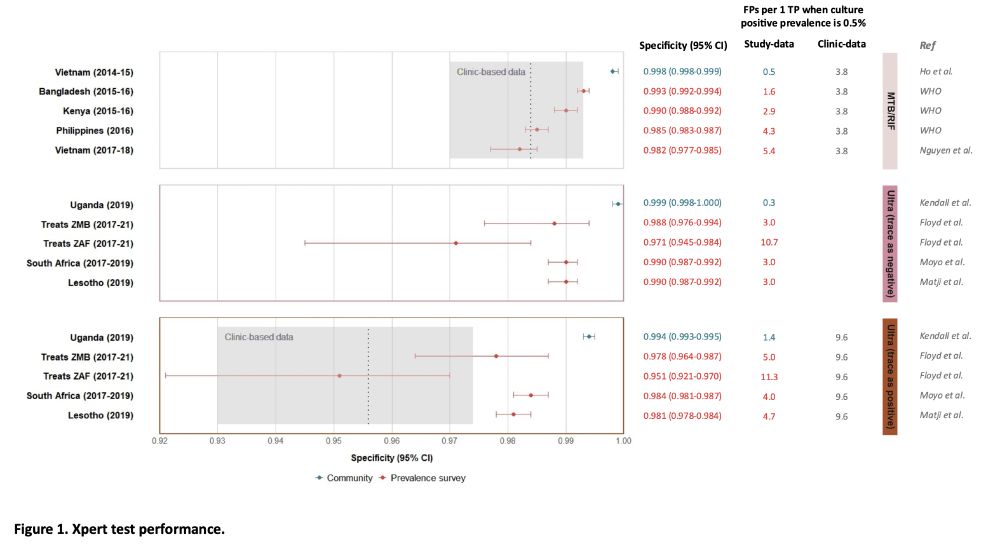
Exploring trade-offs in diagnostic algorithm, population coverage, and duration of community screening for tuberculosis
Background Current tuberculosis (TB) prevention and care strategies have failed to reduce disease burden at the pace required to meet global targets. Community screening may enable more rapid declines...
www.medrxiv.org
Reposted by LSHTM TB Modelling Group

Kate LeGrand
@lekate.bsky.social
· Jul 15
Within-country heterogeneity in patterns of social contact relevant for tuberculosis infection transmission, prevention, and care
Mycobacterium tuberculosis (Mtb) transmission is driven by variable social, environmental, and biological factors, including the number and duration of indoor contacts. Social contact data can provide...
doi.org
Reposted by LSHTM TB Modelling Group
Katherine Horton
@kchorton.bsky.social
· Jul 14
Reposted by LSHTM TB Modelling Group

Reposted by LSHTM TB Modelling Group

Reposted by LSHTM TB Modelling Group

Finn McQuaid
@cfmcquaid.bsky.social
· May 30
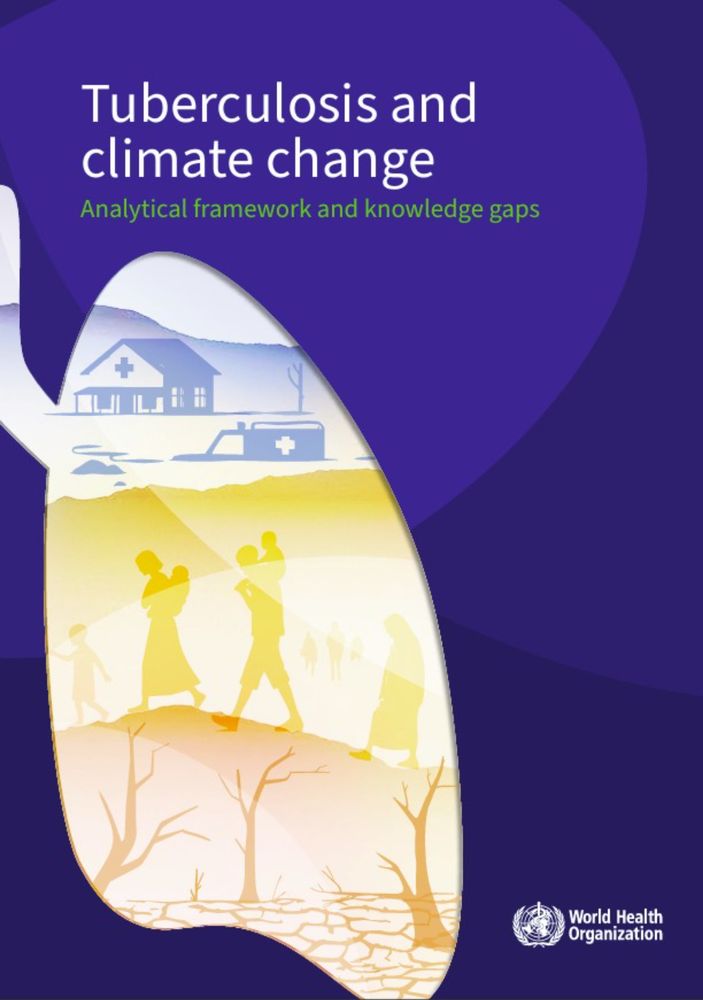
Tuberculosis and climate change: analytical framework and knowledge gaps
This report explores the intersection of tuberculosis (TB) and climate change, highlighting how climate-related challenges such as food and water insecurity, displacement, and disrupted healthcare acc...
www.who.int
Reposted by LSHTM TB Modelling Group

Reposted by LSHTM TB Modelling Group
IDDjobs
@iddjobs.org
· May 20

Reposted by LSHTM TB Modelling Group

Reposted by LSHTM TB Modelling Group
Katherine Horton
@kchorton.bsky.social
· Apr 27
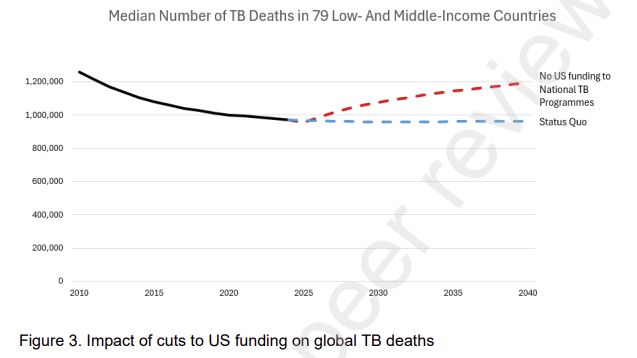
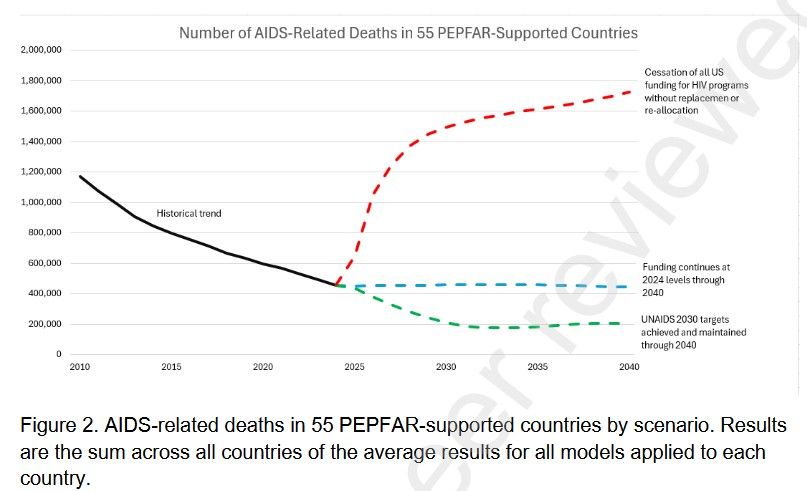
The potential impact of reductions in international donor funding on tuberculosis in low- and middle-income countries
Background Tuberculosis services in many settings rely heavily on international donor funding. In 2025, the United States Agency for International Development (USAID) was dismantled, and other countri...
www.medrxiv.org
Reposted by LSHTM TB Modelling Group
Katherine Horton
@kchorton.bsky.social
· Apr 22

Reposted by LSHTM TB Modelling Group

Reposted by LSHTM TB Modelling Group