Maike Morrison
@maikemorrison.bsky.social
650 followers 160 following 31 posts
Building mathematical tools to answer biological questions Ecology & evolution, sometimes microbiomes & cancer Omidyar Fellow @SFIscience.bsky.social Former PhD student with Noah Rosenberg, Stanford University MaikeMorrison.com
Posts Media Videos Starter Packs
Pinned
maikemorrison.bsky.social
1/ Hey y'all, I'm excited to share my latest paper, which is out now in PNAS! We introduce FAVA, a statistical framework to measure compositional variability across microbiome samples. If you want to measure variability across a stacked bar plot, FAVA is for you! Paper: doi.org/10.1073/pnas...
5 relative abundance plots arranged to have increasing compositional variability (variability across relative abundance samples, here vertical bars)
Reposted by Maike Morrison
davidimiller.bsky.social
🚨 Practical URGENT tip for NSF grantees:

Out of an abundance of caution, I would right now go into Research.gov and…

1. Download your NSF award letters.

2. Print PDF your annual reports.

3. Screenshot the status table for annual reports.

NSF is planning maintenance tomorrow to Research.gov
Due to maintenance, Research.gov (including access to NSF-PAR, GRFP, PES, and ETAP) will be unavailable from Fri., 4/25 at 10:00 PM ET to Sat., 4/26 at 1:00 PM ET. NSF apologizes for any inconvenience.
Reposted by Maike Morrison
jeremymberg.bsky.social
ATTENTION: NSF GRANT RECIPIENTS

We received a heads up from a trusted source that you should proactively download/print/screen shot any documentation on research.gov pertaining to your NSF awards, both those that are current and any that have closed in the last 5-6 years.

1/n
a cartoon of a man holding a frying pan and a spoon with red alert written above him
ALT: a cartoon of a man holding a frying pan and a spoon with red alert written above him
media.tenor.com
maikemorrison.bsky.social
"The silence from the leaders of our university—at least in public—suggests the assault has already produced the intended chilling effect, but together we can overcome it." Good read from Stanford History profs Jessica Riskin and Priya Satia.
stanforddaily.com/2025/03/17/i...
From the Community | Is it 1984 in 2025?
Stanford’s leadership must join with other universities to stand up and fight for American higher education, write Professors Riskin and Satia.
stanforddaily.com
maikemorrison.bsky.social
Thanks! Totally! We have a preprint using a similar framework to look at mutational signature heterogeneity across tumors (collab with @nalcala.bsky.social doi.org/10.1101/2023...) and we also used this framework to look at heterogeneity of immune cell infiltration (analysis not published yet).
Variability of mutational signatures is a footprint of carcinogens
Understanding the genomic impact of carcinogens is fundamental to cancer biology and prevention. However, recent coordinated efforts to detect such fingerprints have been largely unsuccessful, challen...
doi.org
maikemorrison.bsky.social
8/8 FAVA is the culmination of many conversations and collaborations. Thanks especially to my co-authors, @ksxue.bsky.social and Noah Rosenberg–I truly feel like I won the collaborator/mentor lottery. And thanks to you for reading! Paper is here if you want to read more: doi.org/10.1073/pnas...
PNAS
Proceedings of the National Academy of Sciences (PNAS), a peer reviewed journal of the National Academy of Sciences (NAS) - an authoritative source of high-impact, original research that broadly spans...
doi.org
maikemorrison.bsky.social
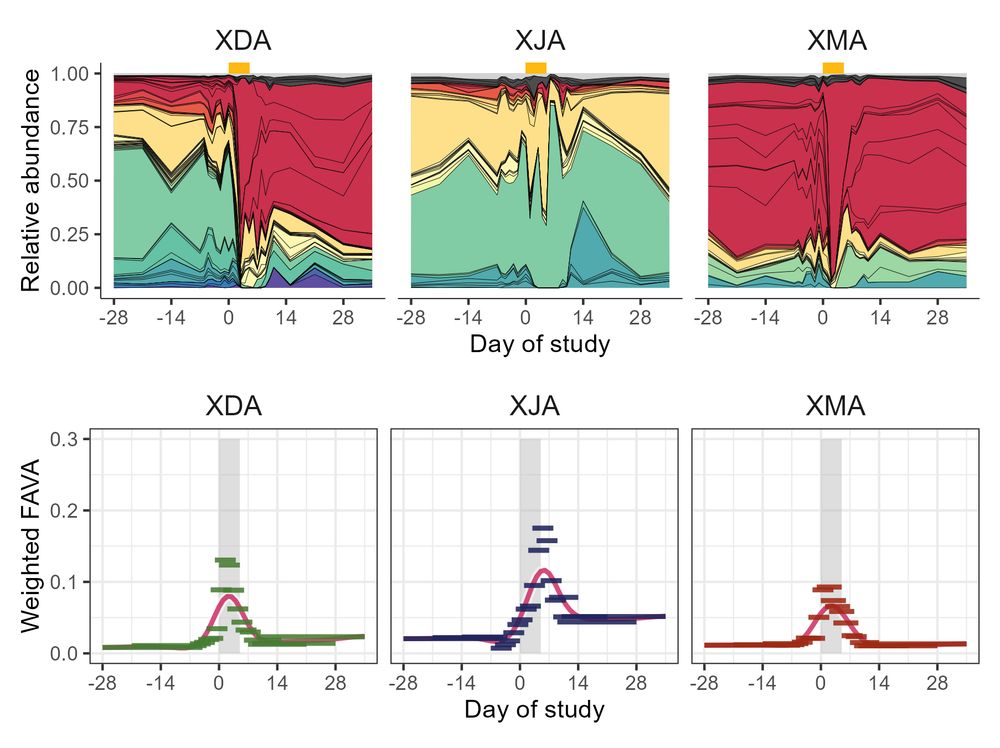
7/ (Ex. 2) In longitudinal microbiome samples from healthy humans taking an antibiotic (collab with @ksxue.bsky.social), FAVA is much higher post-abx than pre-abx, and just half of the 22 subjects return to their baseline FAVA level (computed in 6-sample sliding window) during the 30 days post-abx!
Plot showing longitudinal microbiome composition for three individuals who took an antibiotic, along with corresponding plots showing FAVA computed in sliding windows. For all subjects, FAVA increases during the antibiotic window. In one subject (XDA) we see that FAVA can return to stability (low FAVA) without returning to the pre-abx composition.
maikemorrison.bsky.social
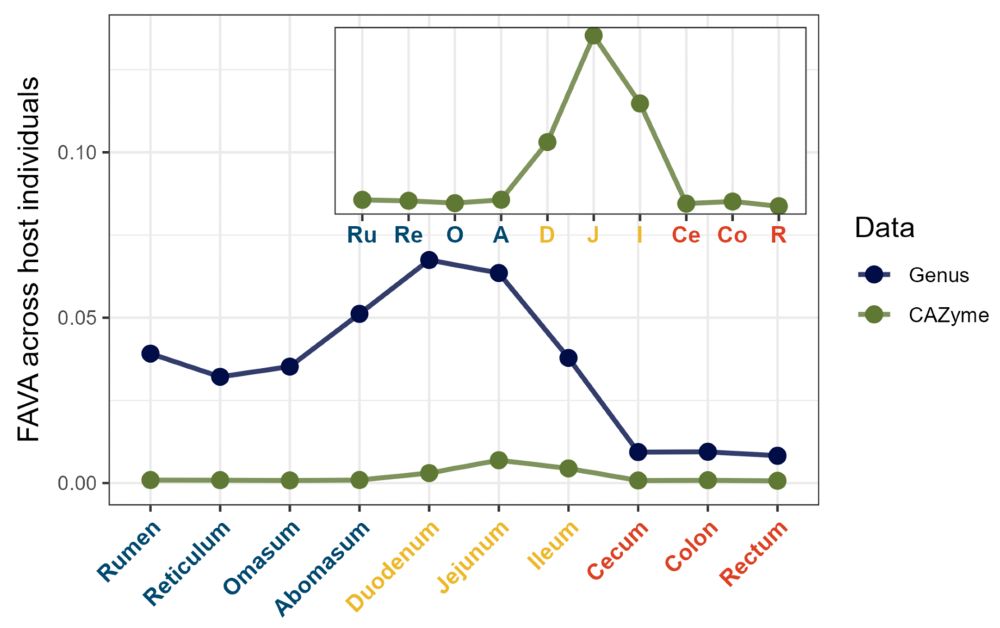
6/ (Ex. 1) In microbiome samples collected along the GI tracts of individuals from 7 ruminant species, FAVA peaks in the small intestine–so lots of variability would have been missed by stool sampling! We also find taxonomic variability >> functional variability–evidence for functional redundancy.
Plot showing FAVA computed with genus or CAZYme abundances across ruminant host individuals. FAVA is much higher for genus than CAZyme abundances. For both data types, FAVA peaks in the small intestine and is quite low in the large intestine, suggesting much variation across individuals would be missed with stool sampling.
maikemorrison.bsky.social
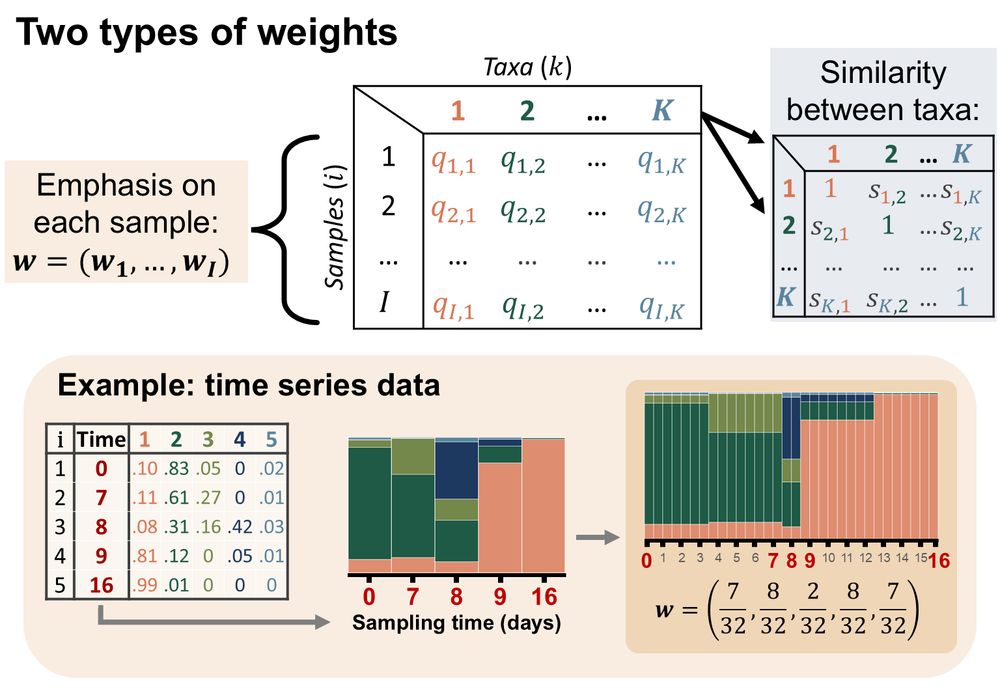
5/ FAVA can account for phylogenetic similarity among taxa and can differentially weight samples, which is especially useful for time series data (Fig. 3). FAVA can be computed in sliding windows to see how variability changes over space or time (Fig. 4). We demonstrate FAVA in 2 examples.
Diagram showing that FAVA can incorporate a matrix giving the similarity between each pair of taxa, as well as a vector of weights for each sample, which can be particularly useful for time series data with uneven sampling times.
maikemorrison.bsky.social
4/ FAVA can analyze any relative abundance data, including taxonomic categories like OTUs and species, and functional categories like CAZymes and COGs. You can directly compare FAVA values computed on data with different numbers of categories (e.g., variability of bacterial species vs. families).
maikemorrison.bsky.social
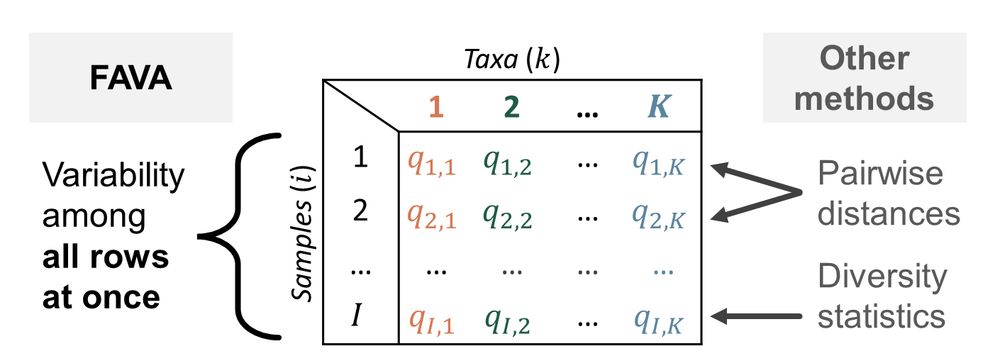
3/ FAVA extends the pop-gen statistic FST (which traditionally measures variability of allele frequencies across multiple populations) to instead measure variability of taxonomic or functional abundances across multiple microbiome samples (Fig. 1). All it needs is an OTU table, or similar.
Schematic showing that FAVA measures variability across all rows of an OTU table at once, while other methods measure the diversity of one sample or the distance between a pair of samples.
maikemorrison.bsky.social
2/ FAVA is implemented in an R package available for download from CRAN (just run install.packages("FAVA") in R). For detailed guidance on the analysis of microbiome data with FAVA, check out the tutorial on the package website: maikemorrison.github.io/FAVA/article...
Analysis of microbiome data with FAVA
maikemorrison.github.io
maikemorrison.bsky.social
1/ Hey y'all, I'm excited to share my latest paper, which is out now in PNAS! We introduce FAVA, a statistical framework to measure compositional variability across microbiome samples. If you want to measure variability across a stacked bar plot, FAVA is for you! Paper: doi.org/10.1073/pnas...
5 relative abundance plots arranged to have increasing compositional variability (variability across relative abundance samples, here vertical bars)
maikemorrison.bsky.social
6/ (Ex. 1) In microbiome samples collected along the GI tracts of individuals from 7 ruminant species, FAVA peaks in the small intestine–so lots of variation would have been missed by stool sampling! We also find taxonomic variability >> functional variability, evidence for functional redundancy!
maikemorrison.bsky.social
5/ FAVA can account for phylogenetic similarity among taxa and can differentially weight samples, which is especially useful for time-series data (Fig. 3). FAVA can be computed in sliding windows to see how variability changes over space or time (Fig. 4). We demonstrate FAVA in 2 examples:
maikemorrison.bsky.social
4/ FAVA can analyze any relative abundance data, including taxonomic categories like OTUs and species, and functional categories like CAZymes and COGs. You can directly compare FAVA values computed on data with different numbers of categories (e.g., variability of bacterial species vs. families).
maikemorrison.bsky.social
3/ FAVA extends the pop-gen statistic FST (which traditionally measures variability of allele frequencies across multiple populations) to instead measure variability of taxonomic or functional abundances across multiple microbiome samples (Fig. 1). All it needs is an OTU table, or similar.
maikemorrison.bsky.social
I've been tremendously fortunate to work with @ksxue.bsky.social during her time as a postdoc at Stanford. She's not only a brilliant scientist and an excellent mentor/collaborator, but also a wonderful human being. You should totally join her lab!
ksxue.bsky.social
Hi friends new and old! I study how microbes interact and evolve in complex communities like the human gut microbiome.🦠🧬💩 I'm thrilled to share that I'm starting a lab at UC Irvine in April 2025 and am recruiting at all levels - please spread the word! kxuelab.com More about my work below...🧵1/n
Xue lab at UC Irvine
Ecology and evolution in the human gut microbiome
kxuelab.com
Reposted by Maike Morrison
goldmandoran.bsky.social
I’m thrilled to share my first ever publication, now published in PNAS! www.pnas.org/doi/10.1073/...

With mentorship from the amazing @ksxue.bsky.social, I looked at how the outcomes of species introductions to microbial communities are influenced by the number of introduced microbes.
PNAS
Proceedings of the National Academy of Sciences (PNAS), a peer reviewed journal of the National Academy of Sciences (NAS) - an authoritative source of high-impact, original research that broadly spans...
www.pnas.org
maikemorrison.bsky.social
Reading "The Science Bargain" by Rush Holt: "Democracy is at risk when it becomes simply a contest of opinions not grounded in evidence. When one opinion is as good as another–each asserted as strongly or even as deceptively as possible–democracy cannot survive. This is a call to science."
maikemorrison.bsky.social
It's been easy to feel powerless these past few months, but the @standupforscience.bsky.social rally in SF this afternoon was an important reminder that the fight is not over!
Maike holding a sign in front of SF city hall. Sign is a parody of the Gadsden flag. Text on bottom says, "don't tread on me." Snake usually on Gadsden flag is replaced with a caterpillar phylogenetic tree. Large crowd in front of SF city hall.
maikemorrison.bsky.social
Today's small joy was discovering the latex package "etaremune," which you can use in place of "enumerate" to count in reverse
maikemorrison.bsky.social
I'm stoked to be at #SMBE2024! If you're interested in variability/diversity, microbiomes, and/or non-traditional applications of FST, I would love to chat!

Poster Weds #44, title: Quantifying the stability of microbiomes and the timescale of antibiotic perturbation with FAVA
Beach with palm trees and a sailboat