Ming Khan
@ming-tfk27.bsky.social
280 followers 120 following 53 posts
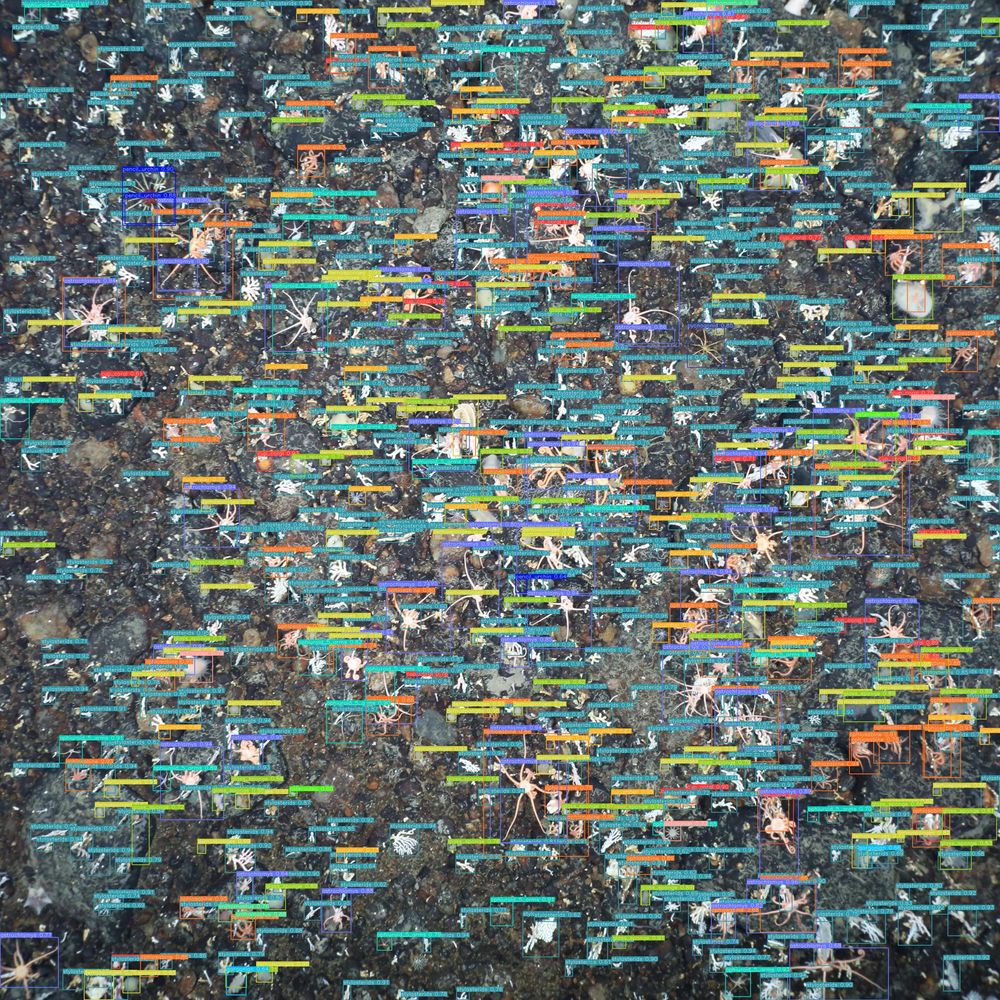
Postdoc at PalaeoFAU Germany, currently studying range shifts in forams. From Bangladesh, previously at University of Cambridge Zoology & British Antarctic Survey (PhD) studying Antarctic benthic ecology; PalaeoFAU (MSc); and Cornell University (BS).
Posts Media Videos Starter Packs
Reposted by Ming Khan
camerontrotter.bsky.social
🇦🇶 Our new paper detailing the automated detection of Antarctic benthic organisms using high-res in situ imagery has been accepted to the #ICCV2025 Joint Workshop on Marine Vision!

📄 Read the preprint now: arxiv.org/abs/2507.21665

🧵1/4
An example output from our framework. An image of the Antarctic seafloor, with hundreds of organisms on it. The organisms each have a bounding box around them, a class label, and a confidence score produced by our framework.
Reposted by Ming Khan
snowqueenofhoth.bsky.social
Photoshopping @lastweektonight.com John Oliver onto fossils until the Paleontological Research Institution secures their funding!

Fossil shell of the ammonite Grossouvrites sp. from the Cretaceous Lopez de Bertodano Fmt of Seymour Isl, Antarctica (PRI 60629). Comedian is H. sapiens. Not to scale.
Comedian John Oliver is edited to appear as if he is peeking out from within an ammonoid fossil, angrily pointing a gun at the viewer
Reposted by Ming Khan
davidho.bsky.social
I get annoyed at the narrative that all the awareness and work on climate change hasn't done anything. Yes, global CO₂ emissions indeed continue to climb, but we don't know the counterfactual. When I was in grad school, we were on track for 5°C of warming. Now it's below 3°C. That's progress.
A line chart titled “Annual CO₂ emissions” shows the global carbon dioxide emissions from fossil fuels and industry from 1950 to 2023. The y-axis represents emissions in billions of tonnes (t), ranging from 0 to 40 billion t. The x-axis covers the years from 1950 to 2023.

The chart presents a steady increase in emissions from approximately 5 billion tonnes in 1950 to over 36 billion tonnes in 2023. Key features include:

A consistent upward trend from 1950 through the early 1970s.

A brief plateau and dip around 1980–1983.

A strong growth trend resuming in the late 1980s.

A sharp increase during the 2000s.

A slight drop around 2008–2009, likely due to the global financial crisis.

A major dip in 2020, attributed to the COVID-19 pandemic.

A rapid rebound in emissions after 2020, continuing the upward trend to a new high in 2023.

A blue line labeled “World” traces these changes over time.

Below the chart, the data source is listed as the Global Carbon Budget (2024), and the graphic is credited to OurWorldInData.org with a Creative Commons license (CC BY). A footnote explains that the data includes emissions from coal, oil, gas, flaring, cement, and steel, but excludes land-use changes such as deforestation.
Reposted by Ming Khan
tinyicybubbles.bsky.social
Lots of Earth System Modelling (🌍ESM) jobs up for grabs at @bas.ac.uk!

🫧 ESM - Past Carbon Cycle (w/ me and Xu Zhang)
🇦🇶 ESM - Antarctic Sea Ice
🌡️ ESM - Past Extremes
🧊 UKESM Sea Ice Model Developer
💧Research Assistant: Palaeoclimate Meltwater Modelling

www.bas.ac.uk/jobs/vacanci...
Reposted by Ming Khan
snowqueenofhoth.bsky.social
Photoshopping John Oliver onto fossils until the Paleontological Research Institution secures their funding!

Section of fossil tree fern, Tempskya wesselli, from the Cretaceous of Idaho. Comedian is H. sapiens. Not to scale.
Comedian John Oliver is edited to appear as if he is sitting on a fossilized fern tree with his legs crossed and smiling.
ming-tfk27.bsky.social
However, the pink morph exhibits dispersal plasticity, and is able to increase its dispersal distances, when in competition with the pink morph in mixed communities, increasing alpha diversity.

Coauthors Huw Griffiths, Nile Stephenson, Rowan Whittle, Autun Purser, Andrea Manica & Emily Mitchell.
ming-tfk27.bsky.social
Furthermore, we discovered that coexistence of the pink and orange morphs is due to inter-morph competition, with the orange morph emerging as the stronger competitor, maintaining its reproductive behaviour across all community types.
ming-tfk27.bsky.social
Using Spatial Point Process Analysis, a method borrowed from forest ecology, we discover that limited dispersal, rather than environment, structured the spatial arrangement of the cup corals. Dispersal limits of 6-10 cm suggests these cup corals are likely brooders, which produce crawl-away larvae.
ming-tfk27.bsky.social
We ask two questions: what processes drive the spatial distribution of Antarctic epibenthic communities at centimeter scales, which has largely been put down to “unknown biological factors”? Second, how do two, apparently very ecologically similar morphs coexist on the Powell Basin?
ming-tfk27.bsky.social
In in-situ seabed photos, they are only distinguishable by the colour of their tentacles, so we term them the “pink” and “orange” morphs. The corals form mixed communities and single population dominant communities, where either morph is near-absent.
ming-tfk27.bsky.social
New paper alert! 🚨

rdcu.be/entY4

In the second paper of my PhD, published today in Scientific Reports, we investigated the spatial ecology of two solitary scleractinian coral morphotoypes, which are likely Caryophyllia or Flabellum, from the Powell Basin slopes of Antarctica 🇦🇶 .
ming-tfk27.bsky.social
Thank you so much!
ming-tfk27.bsky.social
What a crazy last few days… passed my PhD viva on Friday, and just 20 mins ago, the second paper from my PhD just got accepted in Scientific Reports! Woohoo! 🥳
ming-tfk27.bsky.social
Thank you so much for joining! And suggesting we facilitate Zoom attendance!
ming-tfk27.bsky.social
PhDone!!! Passed my viva with minor corrections!

Thanks to @egmitchell.bsky.social @huwiceandstuff.bsky.social @rowanwhittlebas.bsky.social and Andrea Manica for supervising, and Prof Rob Fletcher and @dralexdunhill.bsky.social for examining!
ming-tfk27.bsky.social
Great first day at my new postdoc: jumping off at the deep end with a workshop on AGELESS and BioDeepTime at FAU Palaeo. Will be presenting my PhD work tomorrow as part of the public talks for the meeting.
ming-tfk27.bsky.social
@fossilsndcoffee.bsky.social I will email you and friends once the viva date has been scheduled!
ming-tfk27.bsky.social
So we don’t typically have a public defense, just an oral exam with two examiners. The department encourages a pre-viva talk but it’s not usually done - I however, hope to do so! In which case I will opt for hybrid!
ming-tfk27.bsky.social
Thank you Brendan!!
ming-tfk27.bsky.social
Yay! 😁😁😁
ming-tfk27.bsky.social
My thesis was very kindly supervised by the wonderful @egmitchell.bsky.social , Andrea Manica, @rowanwhittlebas.bsky.social and @huwiceandstuff.bsky.social , based out of @camzoology.bsky.social, the Museum of Zoology and the British Antarctic Survey!
ming-tfk27.bsky.social
I submitted my PhD! Titled “Quantitative ecology reveals scale-dependent structural processes of the Antarctic benthos through time” - in 3.5 years I have 1 paper out (benthic ecosystem function), 1 in 2nd round of review (on competition between coral morphs) and a 3rd in the 1st rounds of review.