Nir Grinberg
@nirg.bsky.social
170 followers 170 following 8 posts
Assistant prof. at BGU in the field of Computational Social Science.
Posts Media Videos Starter Packs
Reposted by Nir Grinberg
yang3kc.bsky.social
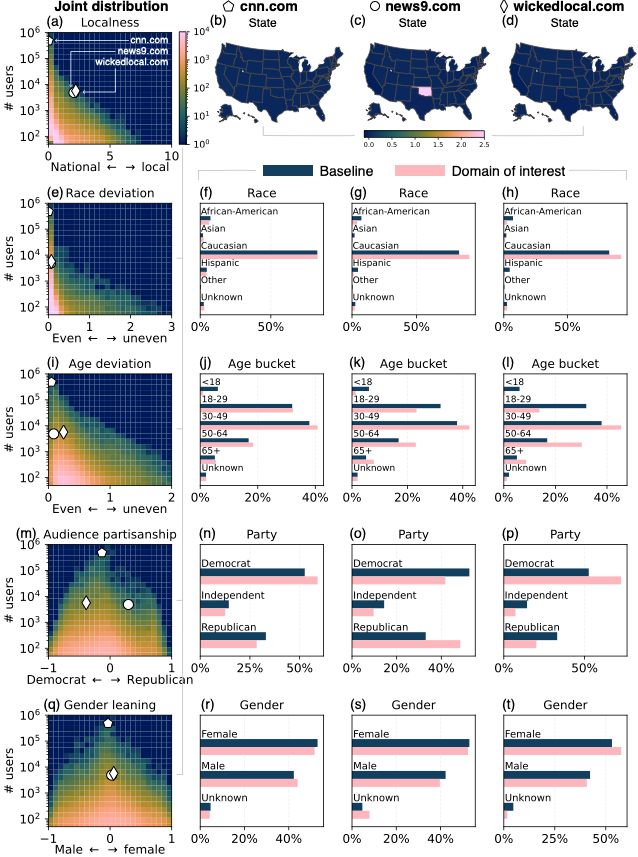
Introducing “DomainDemo: a dataset of domain-sharing activities among different demographic groups on Twitter.”

Today, we release five derived metrics of over 129,000 domains, quantifying their characteristics such as geographical reach and audience partisanship.

1/3
Reposted by Nir Grinberg
rossdahlke.bsky.social
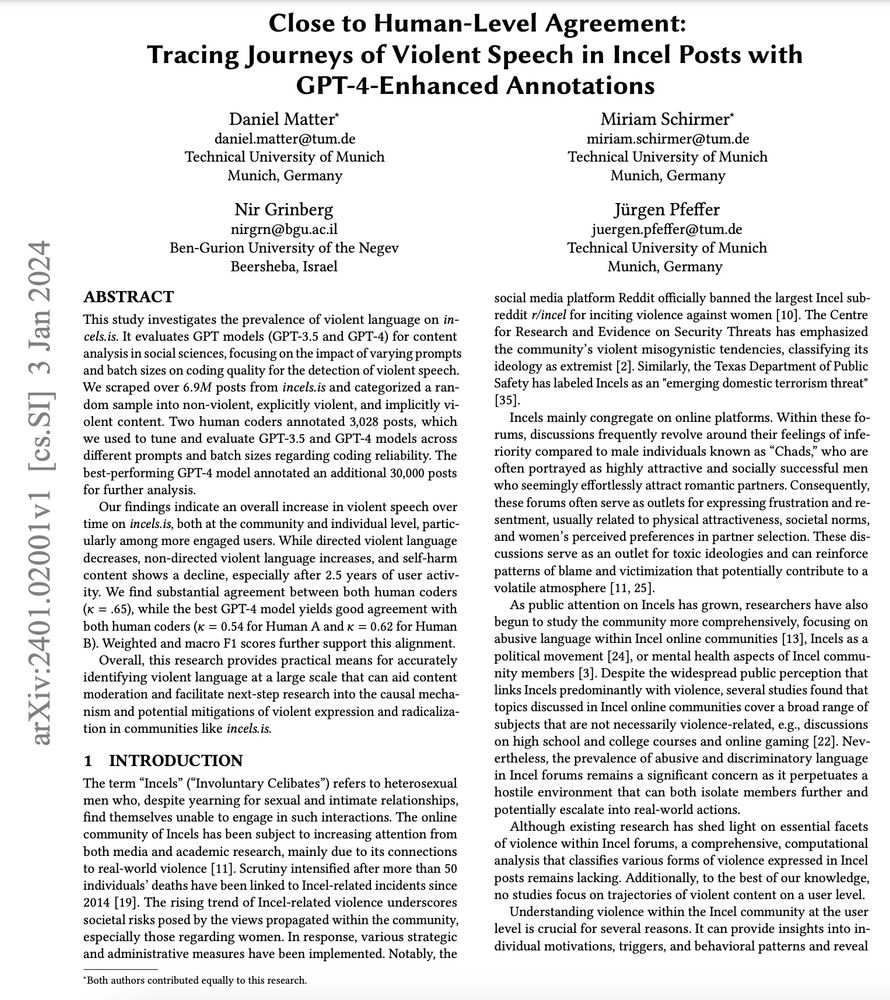
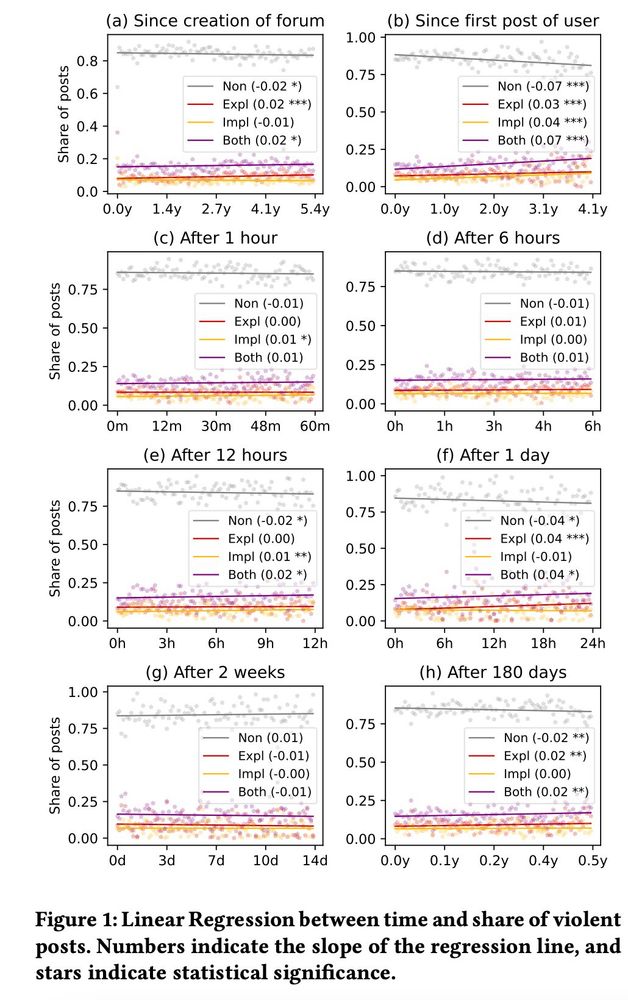
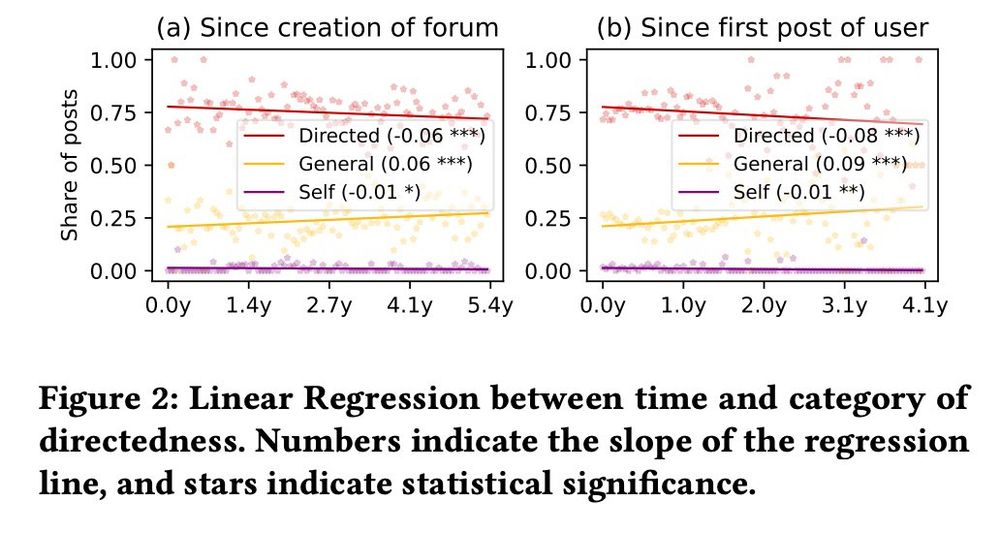
Incels (involuntarily celibates) are increasingly using violent language, particularly non-directed violent language in the largest incel forum, finds @danielmatter.bsky.social @miriamschirmer.bsky.social @nirg.bsky.social @jurgenpfeffer.bsky.social arxiv.org/abs/2401.02001
Close to Human-Level Agreement: Tracing Journeys of Violent Speech in Incel Posts with GPT-4-Enhanced Annotations Figure 1: Linear Regression between time and share of violent posts. Figure 2: Linear Regression between time and category of directedness.
nirg.bsky.social
Awesome! We’d love to hear what you and your students think about it.
nirg.bsky.social
We are also grateful for comments received on earlier versions of this work from Diyi Liu, Eran Amsalem @patyrossini.bsky.social Alon Zoizner, and @orentsur.bsky.social & for funding from European Research Council (ERC), Israel Science Foundation (ISF) and BGU's Data Science Center.
nirg.bsky.social
Big shout-out to the people whose work enabled this research, including @sdmccabe.com @jongreen.bsky.social @davidlazer.bsky.social Magdalena Wojcieszak @jatucker.bsky.social Subhayan Mukerjee @ylelkes.bsky.social @kthorson.bsky.social @chriswells.bsky.social (pls tag others if missing).

6/
nirg.bsky.social
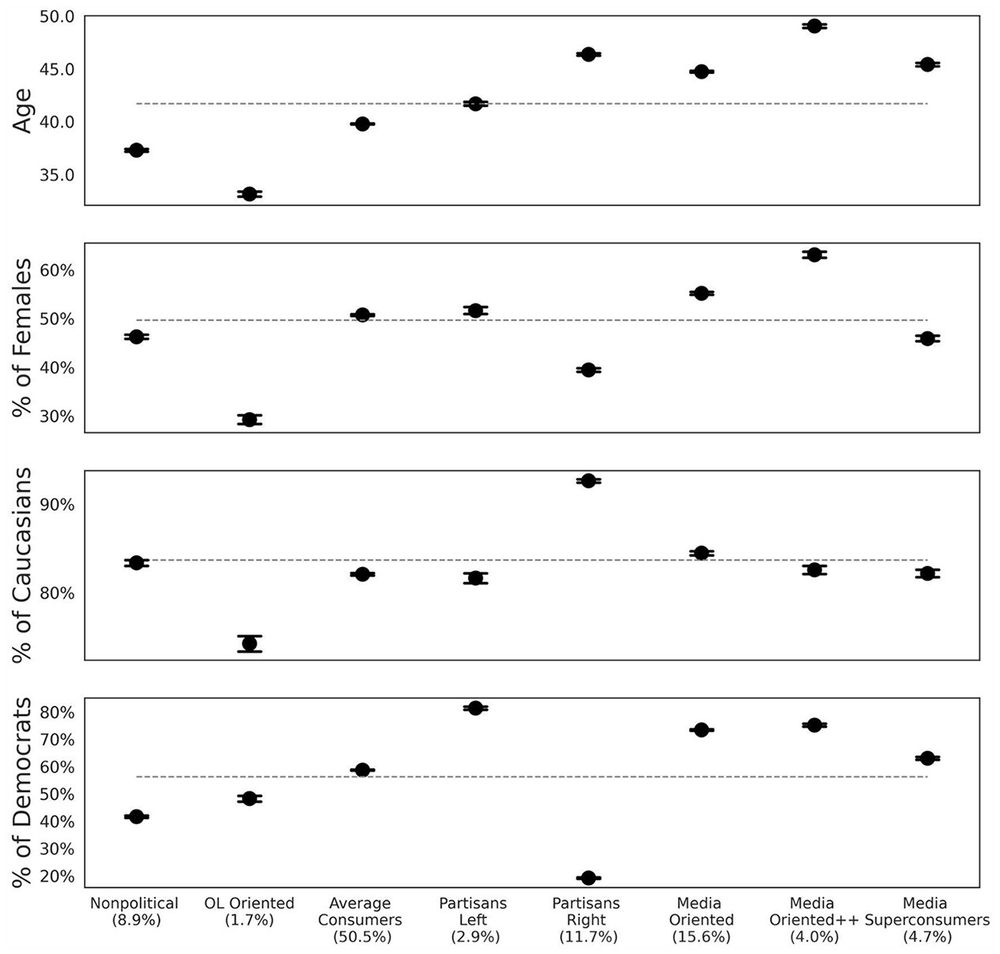
Finally, looking at the demographic composition of consumption "types", we find that the media-oriented clusters (exc. superconsumers) have older individuals, more women, and more registered Democrats.

5/
Sociodemographic characteristics among different political exposure types. Sample averages are marked in a gray dashed line. Ninety-five percent bootstrapped CIs are shown (mostly occluded due to their small size). CI = confidence interval.
nirg.bsky.social
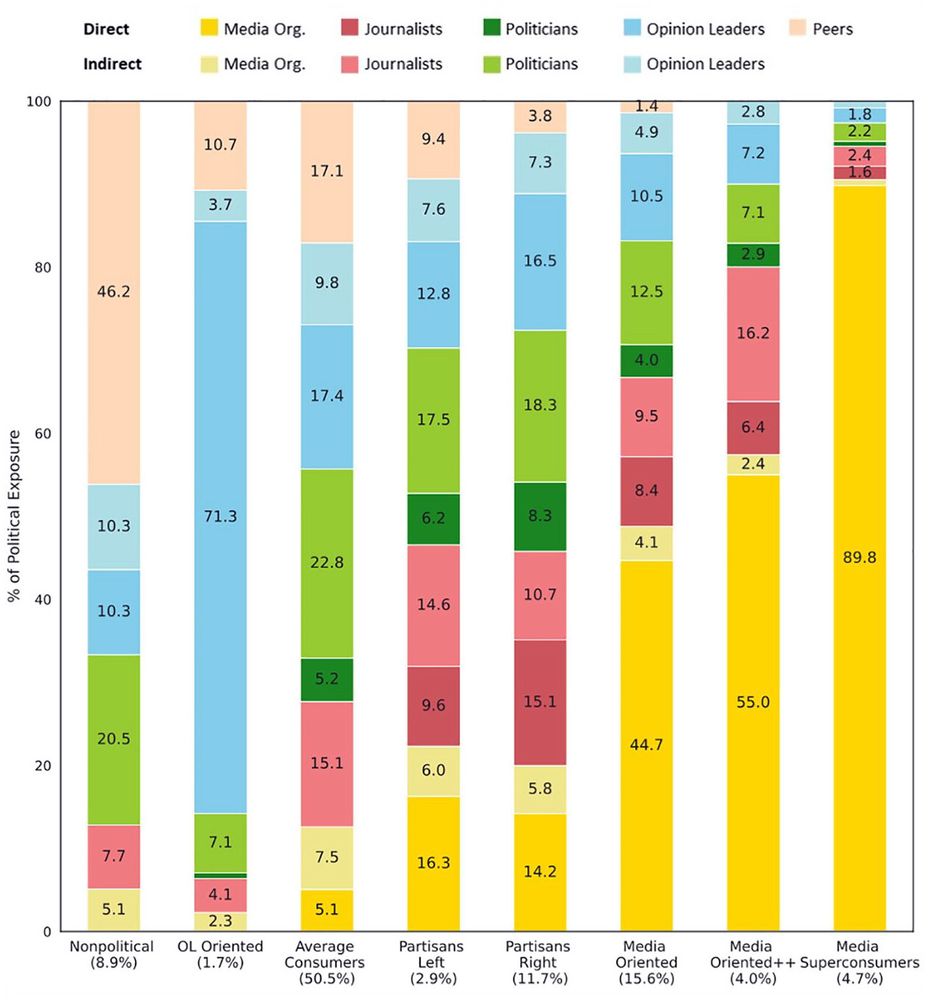
Even when putting aside the more extreme "media superconsumers", the two media-oriented clusters (which are ~20% of the population), get half or more of their political content *directly* from media organizations and journalists, without any mediation from peers.

4/
nirg.bsky.social
Americans also vary in the breakdown of actors that populate their feeds, but interestingly, the bulk of the population gets half or more of their political exposure from *traditional sources*—media organizations, journalists, and politicians.

3/
The composition of political exposure across clusters. The share of politics curated by different actor types (y-axis) across clusters (x-axis). Darker-colored bars represent direct exposure to media organizations, journalists, politicians, OLs, and social peers. Lighter-colored bars represent indirect exposure to media organizations, journalists, politicians, or opinion leaders through social peers. OL = opinion leader.
nirg.bsky.social
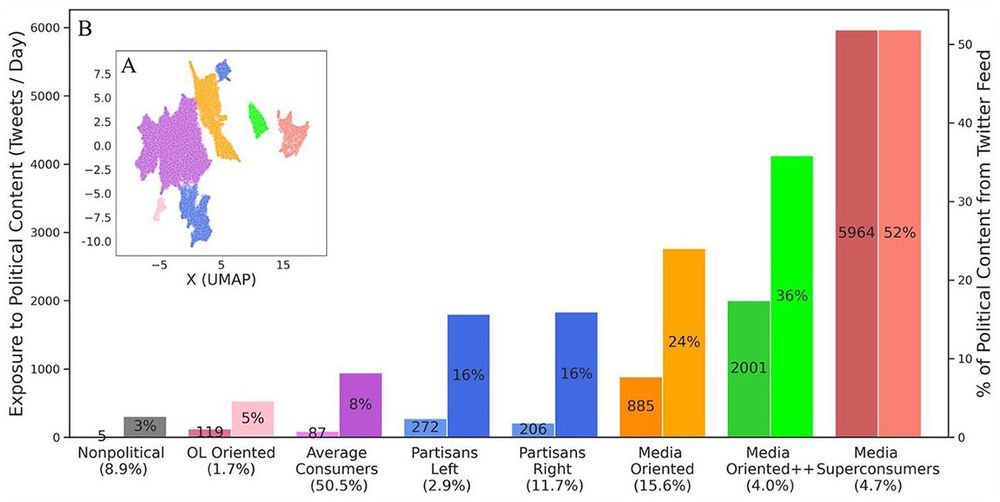
People's political feeds mostly map onto 8 distinct types that vary in the amount of politics they get, both in absolute #'s and as % the feed as a whole. Still, for nearly 90% of the population, about 1 in 12 posts from their network are political. Quite an engaged public!

2/
Prototypical types of individual political exposure. Each point in panel (A) represents the political exposure of a single panel member, reduced to two dimensions using the UMAP algorithm, and colored by the cluster assignment obtained from HDBSCAN. Panel (B) shows the median number of political tweets available to individuals per day (left bars), and their percentage out of all tweets available to them on Twitter (right bars). Cluster labels and their share in the population are specified on the x-axis. Colors are consistent between the two figure panels. Ninety-five percent bootstrapped CIs are omitted from the figure due to their small magnitude, which are upper bounded by twenty-seven exposures to tweets and 0.28 percent, respectively. OL = opinion leader; CI = confidence interval; UMAP = Uniform Manifold Approximation and Projection.
nirg.bsky.social
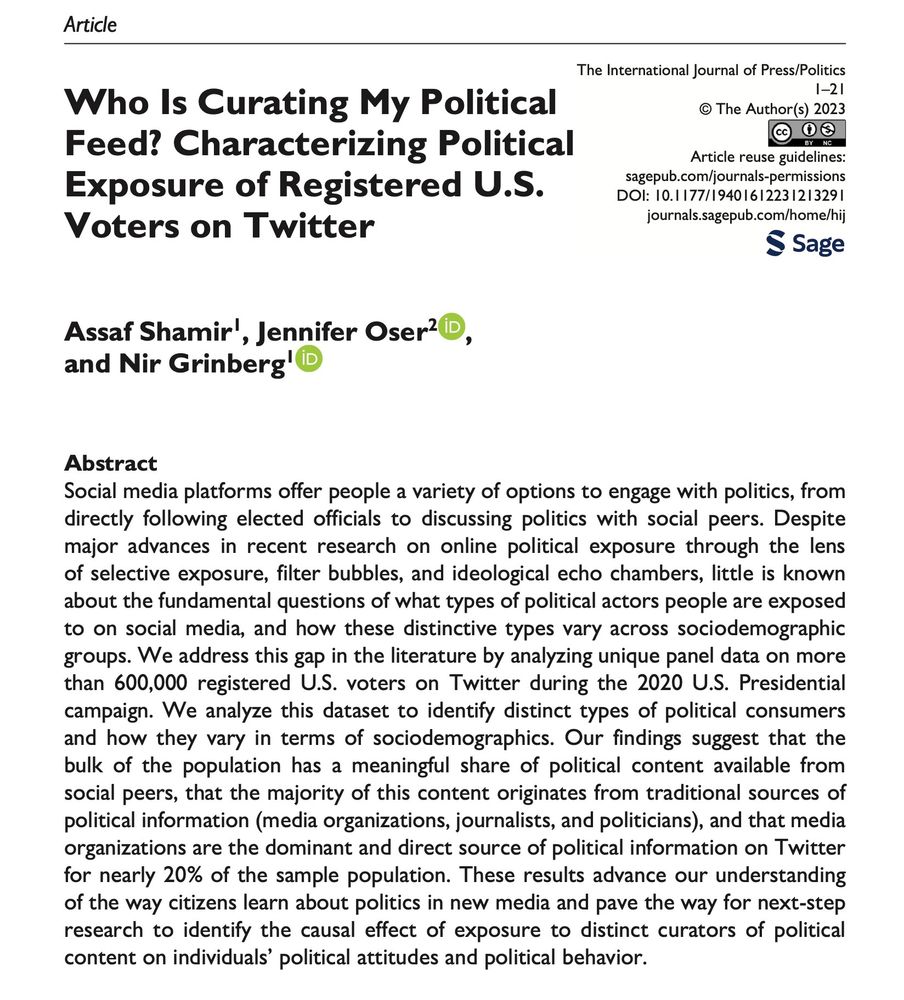
🚨New paper🚨 out in the International Journal of Press/Politics w/ Assaf Shamir and @jenny-oser.bsky.social 🎉

Here's what we learned from studying the composition of political content available to 600k+ registered U.S. voters on Twitter during the 2020 election.

doi.org/10.1177/1940...
🧵👇