Norma B Gordon
@normabgordon.bsky.social
640 followers
130 following
140 posts
🧮 ♾️ Math Ed mentor and coachteacher, normabgordon.com/mathitations
🧘🏽♀️LYT Method® (RYT) normabgordon.com/yoga - sliding scale for educators
Posts
Media
Videos
Starter Packs
Reposted by Norma B Gordon


Reposted by Norma B Gordon


Reposted by Norma B Gordon


Reposted by Norma B Gordon

Jenna Laib
@jennalaib.bsky.social
· Aug 2
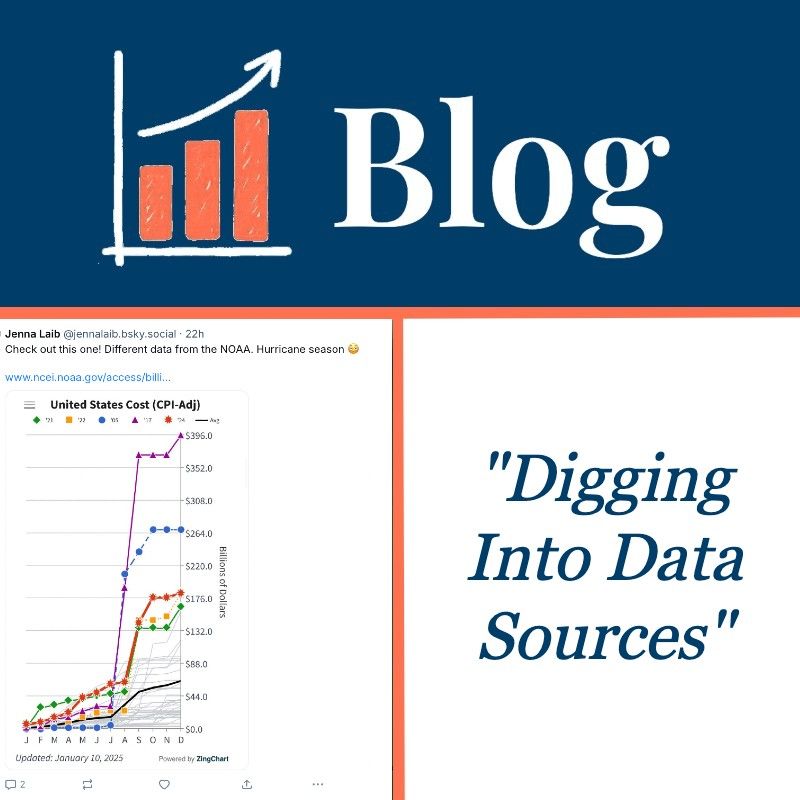
Blog: Digging Into Data Sources
by Jenna Laib "Data" is not neutral. When we look at a data visualization, it can feel cool and objective -- maybe even authoritative. But every graph, chart, or infographic has been shaped by a series of human decisions. Someone decided what to measure and how to measure it. Someone then decided what data to include (or exclude), how to scale the axes, and what labels to use.
slowrevealgraphs.com
Reposted by Norma B Gordon


Reposted by Norma B Gordon

Melynee Naegele
@mnmmath.bsky.social
· Jul 30


Norma B Gordon
@normabgordon.bsky.social
· Jul 27


Norma B Gordon
@normabgordon.bsky.social
· Jul 14

Cost per pound of vehicles compared with per pound of types of cheese - Slow Reveal Graphs
Cost (in USD $) per pound of Vehicles compared with per pound of Types of Cheesegraph by Andrew McCalip/Norma Gordon; slow reveal by Norma Gordon (Slide deck includes notes and questions to elicit dis...
slowrevealgraphs.com

Norma B Gordon
@normabgordon.bsky.social
· Jul 13
Norma B Gordon
@normabgordon.bsky.social
· Jul 12
Jenna Laib
@jennalaib.bsky.social
· Jul 11
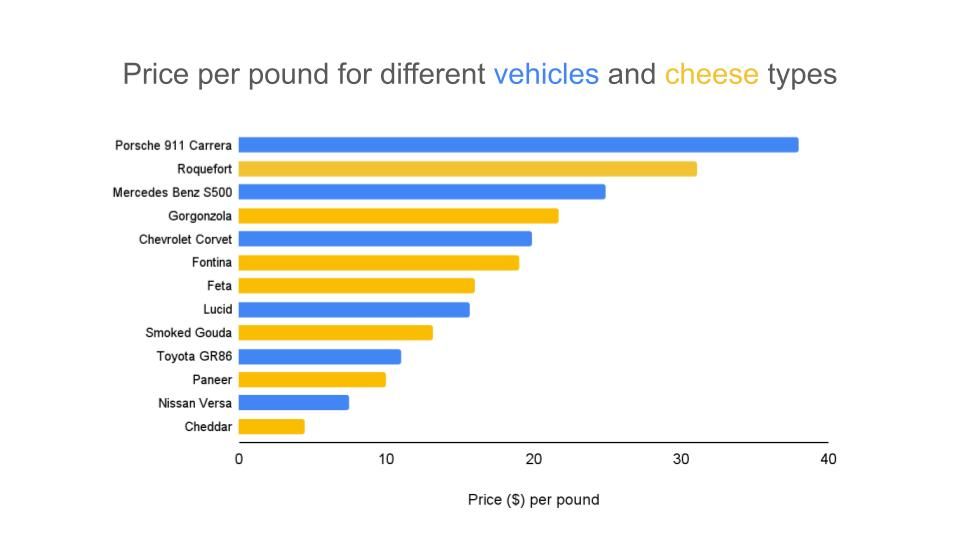
Cost per pound of vehicles compared with per pound of types of cheese
Cost (in USD $) per pound of Vehicles compared with per pound of Types of Cheesegraph by Andrew McCalip/Norma Gordon; slow reveal by Norma Gordon (Slide deck includes notes and questions to elicit discourse) Type of Graph: bar graph Visualization Source: Original graph - McCalip, Andrew (@andrewmccalip). “Since we're talking manufacturing this week... I think a lot about the price of cheese vs vehicles per pound.” …
slowrevealgraphs.com