Pablo Hernández Borges
banner
pablohernandezb.bsky.social
Pablo Hernández Borges
@pablohernandezb.bsky.social
Navigating the Imperium as a Political Scientist and a Computer Engineer, I decode the universe as a Data Scientist because "He who controls the data, controls the future."

🌐 http://pablohernandezb.dev
Building the Venezuela hydrologic map was an R & RStudio masterpiece! 💻✨

I used the terra, elevatr, sf, geodata, rayshader, packages to process the river data, create the elevation model, and render the final 3D view.

What's your favorite R package for maps? 👇

#GIS🛰🗺
October 9, 2025 at 4:57 PM
This map relies on a Coordinate Reference System (CRS) to be accurate! 📐🌐

If you're ever drowning in map projections , epsg.io is your lifesaver. It’s the essential, open-source database to look up any EPSG code.

#GIS #Mapping #GeoSpatial #EPSG #DataScience
October 9, 2025 at 4:57 PM
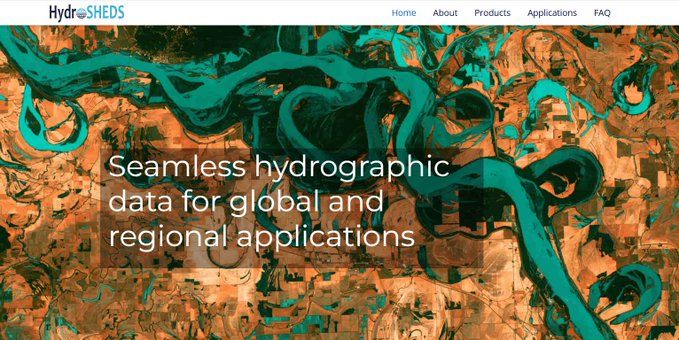
The detail comes from HydroSHEDS data, mapped onto a 3D elevation model. This blend of science and art shows how elevation dictates every path water takes.

The Andes mountains⛰🏔 are clearly the source!

#Mapping #GIS #SciArt
October 9, 2025 at 4:57 PM
📢 New Map Alert! Just finished this detailed 3D hydrologic map of Venezuela🇻🇪. See the country's rivers like never before!

It's time for another #1Week1Project📅💻, find out how you can make your own gorgeous map too!

Let's open a 🧵👇🏽

#HydrologicMap💧🗺
#DataArt🎨📊
October 9, 2025 at 4:57 PM
Hoje tem 300 dias praticando Português🇧🇷 no Duolingo.

Voçe quer falar comigo?

#WorldLanguages🌎💬
September 21, 2025 at 12:42 AM
Before I leave, I want to thank Jesús Ojeda for his help at the beginning of this project, with his guidance I manage to understand how to scrape the data. It's good to have an amazing community of people to turn to for this kind of thing.
September 1, 2025 at 4:41 PM
The two datasets include: (i) National Assembly, and regional with 6667 candidates (3066 females and 3601 males); and (ii) municipal with 15789 candidates, which include 7199 females and 8590 males. And there are 11 types of elections in this cycle.
September 1, 2025 at 4:41 PM
I used Python with the AIOHTTP and AsyncIO libraries to communicate with the web server and iterate through all states, municipalities and districts to create JSON files for each type of election at the candidate-level.

#WebScraping
#DataCollection
September 1, 2025 at 4:41 PM
Thank to Giuseppe Gangi and his video, I got the idea to collect this data using web scraping techniques. And I asked a colleague who helped me kickstart this project that could spark potential research of women ballot placement on authoritarian settings.

🔗 www.youtube.com/watch?v=_jfP...
September 1, 2025 at 4:41 PM
Again, they didn't bring back up their official webpage and instead they used doe.postulaciones.org.ve/eanr2025 and doe.postulaciones.org.ve/em2025 to publish the list of candidates, of course these sites were temporal so I had to act quickly to collect the data.
September 1, 2025 at 4:41 PM
The CNE, lacking transparency and autonomy, programmed this year the regional and parliamentary elections for May 25th and later the municipal elections for July 27th. The time for the campaign was cut short and it was just a few weeks in order to favor the regime.
September 1, 2025 at 4:41 PM
Now, the CNE webpage only exists in the archives of the Wayback Machine, thanks to the @archive.org project. Unfortunately, not all data is there but at least this shows the time when they were supposedly attacked and never came back.
September 1, 2025 at 4:41 PM
Timing was essential for data gathering, because the National Committee Council (CNE in Spanish, the electoral management body in Venezuela) reported they were under a cyberattack during last year's election, and their webpage hasn't been up since then

🔗 latinamericareports.com/venezuelas-e...
September 1, 2025 at 4:41 PM
t's time for another #1Week1Project📅💻, this time I'll discuss the process of creating a dataset of electoral data using web scraping techniques.

This is part of the Gender Parity Analysis in Authoritarian Elections project that takes the country-case of Venezuela.
September 1, 2025 at 4:41 PM
This project is part of a cross-disciplinary collaboration with the Anthropologist @FidelRodV who is interested in characterizing the slave trade voyages and the differences across Southern Caribbean ports.
August 24, 2025 at 6:03 PM
Before I leave, on the @slavevoyages website there is also a People Database that includes registry of over 90,000 enslaved and over 30,000 enslavers. This big dataset can also be used to kickstart research on these topics.
August 24, 2025 at 6:03 PM
Finally, I leave this short descriptive analysis if the data with this plot comparing the flag of the vessel between Intra-American and Trans-Atlantic voyages. Again, there are stark differences, Intra-American are dominated by the British while the Trans-Atlantic by the Dutchs.
August 24, 2025 at 6:03 PM
There are also different trends in trade voyages arrival by region, I believe they vary based on the characteristics of the ports of disembarkation and the needs of labor from each of the regions. This is one of the conundrums this research aims to address.
August 24, 2025 at 6:03 PM
It is interesting to see the differences in outcomes by type of journey, Intra-American voyages, shorter in distance, are more secure than Trans-Atlantic ones. Of course, these are observations from preliminary and descriptive analysis.
August 24, 2025 at 6:03 PM
It's worth noting that the Trans-Atlantic voyages not only come from West Africa, but also include East African ports.
August 24, 2025 at 6:03 PM
This map from #SlavesVoyages roughly shows the area of study. After creating the sample dataset, forty ports in the Southern Caribbean are included, it contains 4,502 voyages (2,794 Trans-Atlantic and 1,708 intra-American).
August 24, 2025 at 6:03 PM
While the impressive dataset covers four centuries and most of all the voyages occurred in that era through the Atlantic Ocean and the Caribbean Sea, our focus for this particular project will be mostly on the Southern Caribbean.
August 24, 2025 at 6:03 PM
After data cleaning, there are 74,117 voyages, 37,777 Intra-American and 36,340 Trans-Atlantic. Here you can visualize the trends of each type of journey throughout the years. At the beginning of the XIX century, Intra-American voyages surpassed Trans-Atlantic ones.
August 24, 2025 at 6:03 PM
I first noticed this data comes from historical records, and most of the 49 variables have missing values, which is understandable. But thanks to imputation methods, some variables have very low levels of missingness and can be used for this project.
August 24, 2025 at 6:03 PM
The datasets used on this project can be downloaded from the #slavevoyages site: slavevoyages.org, the "Voyages" section allows you to explore the data online and even has dynamic map visualizations that display slave voyages throughout the 1500s to the 1800s.
August 24, 2025 at 6:03 PM