Sebastian Beyer
@sbeyer.net
25 followers 26 following 2 posts
Scientist and scientific programmer. Working on km-scale climate models.
Posts Media Videos Starter Packs
sbeyer.net
Wait, there are math optimizations that are fun and safe?! Sign me up!

--funsafe-math-optimizations
Reposted by Sebastian Beyer
marylouathanase.bsky.social
To celebrate the kick-off of #UNOC3 and #OOSC in Nice, we share a striking, mesmerising perspective on Mediterranean Marine Heatwaves —and their clear amplification by climate change.

From @awi.de storyline simulations, visual by @jawijan.bsky.social
Reposted by Sebastian Beyer
jnwhnr.bsky.social
🌪️ Typhoon spotted in a global 4.4km IFS-FESOM run.
Visualizing cloud structures using only model data — aiming to match the look of satellite imagery. Impressive how close simulations can get.
@awi.de @blender3d.bsky.social @blender.org
Reposted by Sebastian Beyer
jnwhnr.bsky.social
For a new visualization project @awi.de, I’m currently experimenting with satellite imagery, elevation data, and OSM. Exciting!

@blender.org
Reposted by Sebastian Beyer
jnwhnr.bsky.social
Exploring ways to visualise wind together with my colleague @sbeyer.net at AWI. Here’s a glimpse: IFS-FESOM wind speed visualised as coloured particles.
Reposted by Sebastian Beyer
ecmwf.int
ECMWF @ecmwf.int · Feb 24
🌍🌐 What if we could replay recent extreme weather under different climate conditions? With storyline simulations in the EU’s #DestinE initiative, scientists are reconstructing past, present, and future extreme weather to help us adapt to climate change. Learn more ➡️ destine.ecmwf.int/news/replayi...
sbeyer.net
Experimenting a little bit with #blender particle systems and simulated wind data
Reposted by Sebastian Beyer
mzapponi.bsky.social
Sea ice meets ocean eddies, part II!
Folllowing @oceanographer.bsky.social's idea I used the data from my simulation (still #FESOM2 but 10km this time) to explore the flames of the frozen ocean. 🧊 🔥
Reposted by Sebastian Beyer
trackow.bsky.social
First post on @bsky.app 🎉:

Can #AI-based weather forecasting models (trained on present-day data) provide skillful forecasts also in different colder and warmer states of the climate system?

Our preprint in arxiv explores this question:
doi.org/10.48550/arX...

Here is what we found so far (🧵1/7)
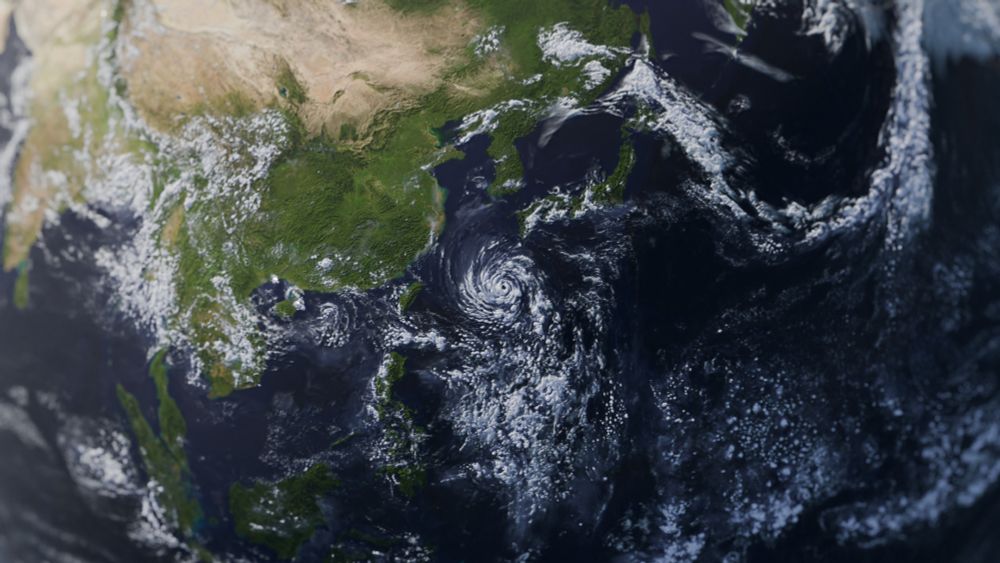
Robustness of AI-based weather forecasts in a changing climate
Data-driven machine learning models for weather forecasting have made transformational progress in the last 1-2 years, with state-of-the-art ones now outperforming the best physics-based models for a ...
doi.org
Reposted by Sebastian Beyer
oceanographer.bsky.social
To celebrate Antarctica Day, here is an image of winds around Antarctica as simulated by a 4 km resolution atmospheric model. 🧪

Model: IFS-FESOM | Shown: U component of wind | Project: nextGEMS #SciArt
Reposted by Sebastian Beyer
oceanographer.bsky.social
The storyline approach isn’t new, but for the first time, we’re using it with 10km resolution! 🌍 See how extreme events might have looked in the past, without climate change, and how they could unfold in a +2°C future. Check out our work led by Amal John: essopenarchive.org/users/852952...
The maximum 2m-temperature during the peak heatwave period (July 25, 2019) over France for the different storyline experiments (top panels: a, b, c). The bottom chart illustrates the hourly maximum 2m-temperature from the different experiments for the Paris region inside the black dotted box (48.5-49°N and 2.0-3.0°E). This comparison highlights the varying intensity of the heatwave across different climates.