
Thomas Rackow 🧊
@trackow.bsky.social
760 followers
440 following
55 posts
Scientist @ecmwf.int : climate & ocean variability, kilometre-scale modelling, and its visualisation. #art and music enthusiast. #scicomm
Posts
Media
Videos
Starter Packs
Pinned
Thomas Rackow 🧊
@trackow.bsky.social
· Dec 5

Recent global temperature surge intensified by record-low planetary albedo
In 2023, the global mean temperature soared to almost 1.5K above the pre-industrial level, surpassing the previous record by about 0.17K. Previous best-guess estimates of known drivers including anthr...
doi.org
Reposted by Thomas Rackow 🧊

Reposted by Thomas Rackow 🧊

Jens Terhaar
@polarocean.bsky.social
· Mar 12
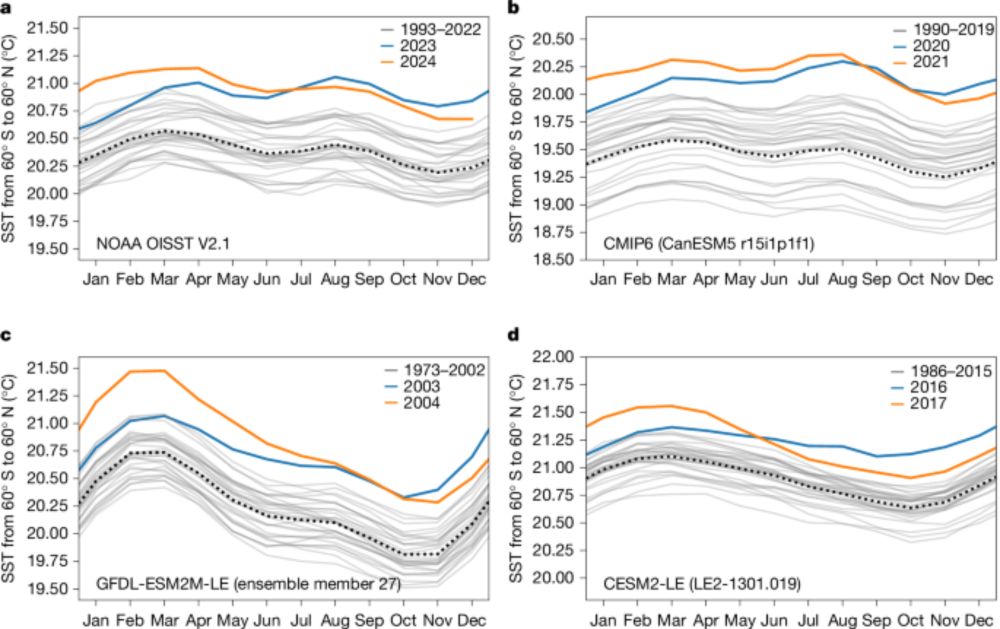
Record sea surface temperature jump in 2023–2024 unlikely but not unexpected - Nature
Observations and climate models suggest that the global sea surface temperature jump in 2023–2024 was not unexpected and would have been nearly impossible without anthropogenic warming.
www.nature.com


Reposted by Thomas Rackow 🧊


Reposted by Thomas Rackow 🧊

Reposted by Thomas Rackow 🧊


Reposted by Thomas Rackow 🧊

Reposted by Thomas Rackow 🧊
Thibault Guinaldo
@tguinaldo.bsky.social
· May 13
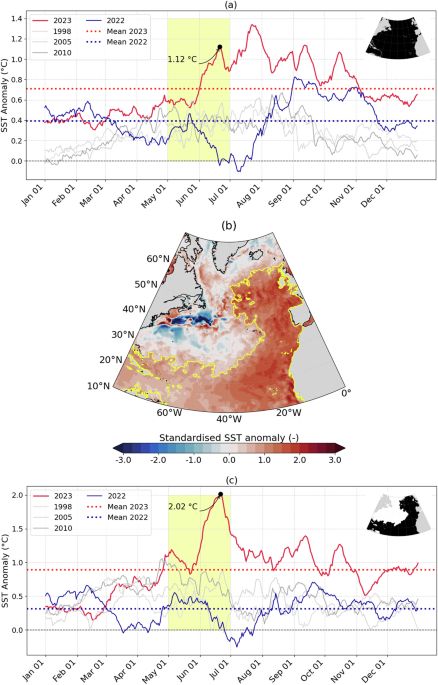
Internal variability effect doped by climate change drove the 2023 marine heat extreme in the North Atlantic - Communications Earth & Environment
The 2023 North Atlantic marine heatwave was driven by an extreme phase of internal atmospheric variability but would have been impossible without the doping effect of anthropogenic warming, according ...
www.nature.com
Reposted by Thomas Rackow 🧊
Jens Terhaar
@polarocean.bsky.social
· Mar 12
Record sea surface temperature jump in 2023–2024 unlikely but not unexpected - Nature
Observations and climate models suggest that the global sea surface temperature jump in 2023–2024 was not unexpected and would have been nearly impossible without anthropogenic warming.
www.nature.com
Reposted by Thomas Rackow 🧊


Reposted by Thomas Rackow 🧊


Reposted by Thomas Rackow 🧊


Reposted by Thomas Rackow 🧊
Reposted by Thomas Rackow 🧊
Reposted by Thomas Rackow 🧊

Reposted by Thomas Rackow 🧊

Reposted by Thomas Rackow 🧊

Thomas Rackow 🧊
@trackow.bsky.social
· Mar 19
Thomas Rackow 🧊
@trackow.bsky.social
· Mar 19
Thomas Rackow 🧊
@trackow.bsky.social
· Mar 13
Thomas Rackow 🧊
@trackow.bsky.social
· Mar 13