


Tugberk Samur
@tugberksamur.bsky.social
Sustainability Lecturer at @HMSM
363 ppm CO2
1753 ppb CH4
+0.6 °C
363 ppm CO2
1753 ppb CH4
+0.6 °C
Reposted by Tugberk Samur

The linear extrapolation of the past 15 years and the nonlinear 30-year extrapolation now both put global warming at +1.54°C above 1850-1900.
Reaching +2°C in 2037 or 2034.
Using the @ecmwf.int ERA5 dataset.
H/t @tugberksamur.bsky.social
Reaching +2°C in 2037 or 2034.
Using the @ecmwf.int ERA5 dataset.
H/t @tugberksamur.bsky.social

December 18, 2025 at 10:58 PM
The linear extrapolation of the past 15 years and the nonlinear 30-year extrapolation now both put global warming at +1.54°C above 1850-1900.
Reaching +2°C in 2037 or 2034.
Using the @ecmwf.int ERA5 dataset.
H/t @tugberksamur.bsky.social
Reaching +2°C in 2037 or 2034.
Using the @ecmwf.int ERA5 dataset.
H/t @tugberksamur.bsky.social
Reposted by Tugberk Samur
It can no longer be denied: Climate change is progressing unabated and accelerating.
1.5°C limit for global warming agreed upon in Paris may already have been permanently exceeded.
3°C limit could be exceeded as early as 2050'
2/8
1.5°C limit for global warming agreed upon in Paris may already have been permanently exceeded.
3°C limit could be exceeded as early as 2050'
2/8

September 25, 2025 at 2:57 PM
It can no longer be denied: Climate change is progressing unabated and accelerating.
1.5°C limit for global warming agreed upon in Paris may already have been permanently exceeded.
3°C limit could be exceeded as early as 2050'
2/8
1.5°C limit for global warming agreed upon in Paris may already have been permanently exceeded.
3°C limit could be exceeded as early as 2050'
2/8
Reposted by Tugberk Samur
3°C of global warming by 2050 might be hard to imagine, but it could happen if the non-linear warming trend of the past 30 years continues.
See this graph with @ecmwf.int ERA5 data (trend line has an R² of 0.975), made using the code they provided, by
@tugberksamur.bsky.social
8/8
See this graph with @ecmwf.int ERA5 data (trend line has an R² of 0.975), made using the code they provided, by
@tugberksamur.bsky.social
8/8

September 25, 2025 at 2:57 PM
3°C of global warming by 2050 might be hard to imagine, but it could happen if the non-linear warming trend of the past 30 years continues.
See this graph with @ecmwf.int ERA5 data (trend line has an R² of 0.975), made using the code they provided, by
@tugberksamur.bsky.social
8/8
See this graph with @ecmwf.int ERA5 data (trend line has an R² of 0.975), made using the code they provided, by
@tugberksamur.bsky.social
8/8
I have updated the graph. So our remaining carbon budget might be depleted by the end of this year or 2026 with the current warming rate, unlike the assumptions here: essd.copernicus.org/preprints/es...
That is quite the upper range of IPCC projections.
That is quite the upper range of IPCC projections.


January 11, 2025 at 2:00 PM
I have updated the graph. So our remaining carbon budget might be depleted by the end of this year or 2026 with the current warming rate, unlike the assumptions here: essd.copernicus.org/preprints/es...
That is quite the upper range of IPCC projections.
That is quite the upper range of IPCC projections.
Reposted by Tugberk Samur
There's very little reason to assume 30-year linear warming extrapolation.
Emissions, forcings, Earth's Energy Imbalance and (especially variability corrected) temperature observations all indicate acceleration of global warming.
We should prepare for reaching +2.0°C soon!
Emissions, forcings, Earth's Energy Imbalance and (especially variability corrected) temperature observations all indicate acceleration of global warming.
We should prepare for reaching +2.0°C soon!

December 14, 2024 at 11:52 AM
There's very little reason to assume 30-year linear warming extrapolation.
Emissions, forcings, Earth's Energy Imbalance and (especially variability corrected) temperature observations all indicate acceleration of global warming.
We should prepare for reaching +2.0°C soon!
Emissions, forcings, Earth's Energy Imbalance and (especially variability corrected) temperature observations all indicate acceleration of global warming.
We should prepare for reaching +2.0°C soon!
@pfriedling.bsky.social @piersforster.bsky.social @robinlamboll.bsky.social @joerirogelj.bsky.social
Considering the RCB methodologies and the current data, is this graph logical?
Considering the RCB methodologies and the current data, is this graph logical?

December 14, 2024 at 1:55 AM
@pfriedling.bsky.social @piersforster.bsky.social @robinlamboll.bsky.social @joerirogelj.bsky.social
Considering the RCB methodologies and the current data, is this graph logical?
Considering the RCB methodologies and the current data, is this graph logical?
Reposted by Tugberk Samur
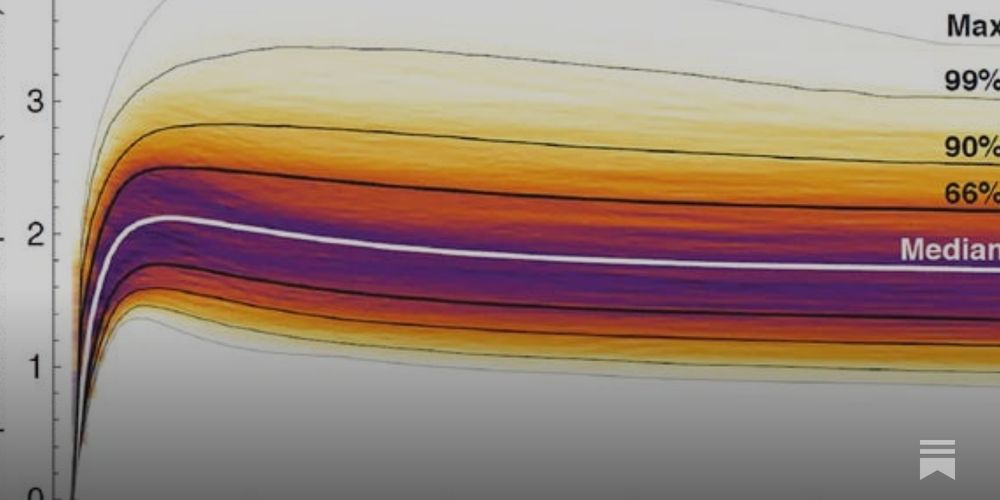
Note this is for CO2 emissions, not all GHGs. If methane emissions stopped (which we can't, at least not entirely), global warming would not just stabilise but reduce by about 0.5°C over the following century.

On The Climate Brink: Stop emissions, stop warming: A climate reality check
This is a crucial point because it determines how much warming is already "locked in" and effectively unavoidable.
The answer is very little warming is locked in.
Also, this is our 100th post!
www.theclimatebrink....
This is a crucial point because it determines how much warming is already "locked in" and effectively unavoidable.
The answer is very little warming is locked in.
Also, this is our 100th post!
www.theclimatebrink....
Stop emissions, stop warming: A climate reality check
Why future warming isn't as "locked in" as you might think
www.theclimatebrink.com
December 3, 2024 at 1:15 AM
Note this is for CO2 emissions, not all GHGs. If methane emissions stopped (which we can't, at least not entirely), global warming would not just stabilise but reduce by about 0.5°C over the following century.
Slowly moving here as I notice valuable people moving as well. Where they are, I want to be. No bots (yet), no stupid ads, no far-right madness.
November 22, 2024 at 7:31 PM
Slowly moving here as I notice valuable people moving as well. Where they are, I want to be. No bots (yet), no stupid ads, no far-right madness.