W. Joel Schneider
@w-joel-schneider.bsky.social
100 followers 190 following 31 posts
Professor at Temple University, PA. Interested in Psychological Assessment, Psychometrics, Statistics, Psychotherapy, R
Posts Media Videos Starter Packs
w-joel-schneider.bsky.social
Recreating each of the tables in Chapter 7 of the Publication Manual of the American Psychological Association (7th Edition) in R with apa7 (Part 24 of 24)

Featuring hanging indents

#rstats #apastyle

wjschne.github.io/posts/apatab...
APA-formatted table with quotes from a qualitative study
w-joel-schneider.bsky.social
Recreating each of the tables in Chapter 7 of the Publication Manual of the American Psychological Association (7th Edition) in R with apa7 (Part 23 of 24)

Featuring hanging indents and vertical merging

#rstats #apastyle

wjschne.github.io/posts/apatab...
APA-formatted table with descriptive statistics and sample quotes
w-joel-schneider.bsky.social
Recreating each of the tables in Chapter 7 of the Publication Manual of the American Psychological Association (7th Edition) in R with apa7 (Part 22 of 24)

Featuring hanging indents

#rstats #apastyle

wjschne.github.io/posts/apatab...
APA-formatted table showing narratives from a qualitative study
w-joel-schneider.bsky.social
Recreating each of the tables in Chapter 7 of the Publication Manual of the American Psychological Association (7th Edition) in R with apa7 (Part 21 of 24)

Featuring thin spaces for footnote superscripts and `add_star_column`

#rstats #apastyle

wjschne.github.io/posts/apatab...
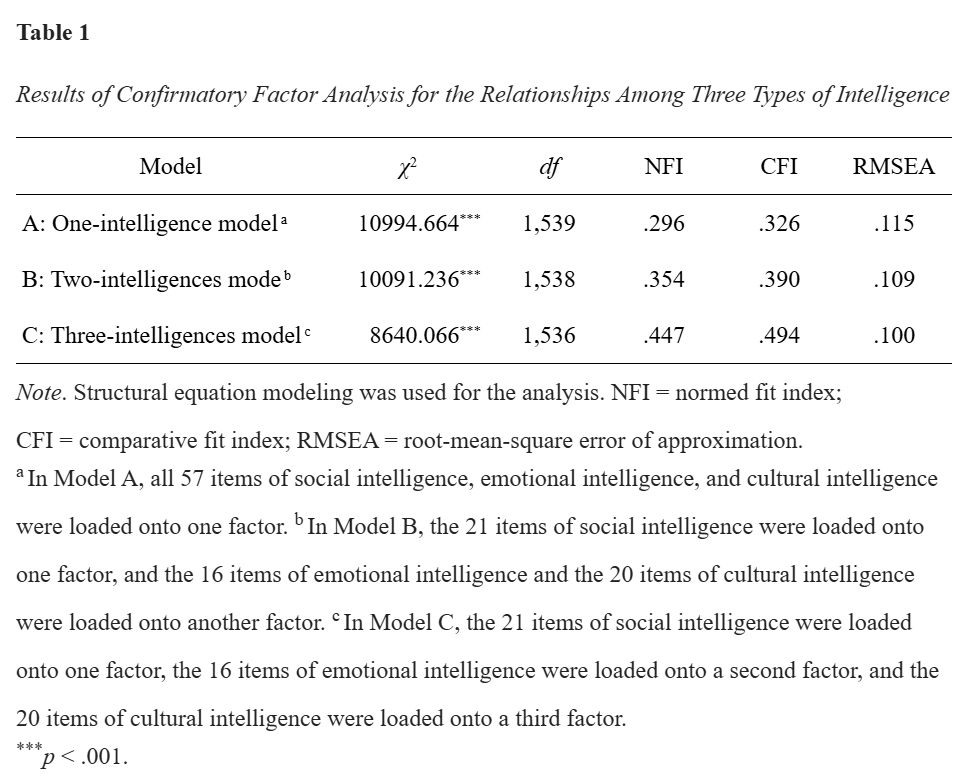
APA-formatted table of confirmatory factor analysis performance statistics
w-joel-schneider.bsky.social
Recreating each of the tables in Chapter 7 of the Publication Manual of the American Psychological Association (7th Edition) in R with apa7 (Part 20 of 24)

Presenting multilevel models

#rstats #apastyle

wjschne.github.io/posts/apatab...
An APA-formatted table with results from a multilevel model analysis
Reposted by W. Joel Schneider
vincentab.bsky.social
{tinytable} 0.14.0 for #RStats makes it super easy to draw tables in html, tex, docx, typ, md & png.

There are only a few functions to learn, but don't be fooled! Small 📦s can still be powerful.

Check out the new gallery page for fun case studies.

vincentarelbundock.github.io/tinytable/vi...
a table about lemurs a table about students and schools a table about wines
w-joel-schneider.bsky.social
Recreating each of the tables in Chapter 7 of the Publication Manual of the American Psychological Association (7th Edition) in R with apa7 (Part 19 of 24)

Presenting a sequence of regression models

#rstats #apastyle

wjschne.github.io/posts/apatab...
APA-formatted table with model performance statistics
w-joel-schneider.bsky.social
Recreating each of the tables in Chapter 7 of the Publication Manual of the American Psychological Association (7th Edition) in R with apa7 (Part 18 of 24)

Featuring hierarchical regression analyses

#rstats #apastyle

wjschne.github.io/posts/apatab...
APA-formatted table displaying hierarchical regression analyses
w-joel-schneider.bsky.social
Recreating each of the tables in Chapter 7 of the Publication Manual of the American Psychological Association (7th Edition) in R with apa7 (Part 17 of 24)

Featuring footnotes and intentionally inconsistent rounding

#rstats #apastyle

wjschne.github.io/posts/apatab...
APA-formatted table showing multilevel modeling results
Reposted by W. Joel Schneider
rmkubinec.bsky.social
Here's a little #rstats script I wrote to automate creating Google docs for my students for an assignment. The idea is that the history in the Google doc will help secure the integrity of the assignment by discouraging gen AI use.

#academicsky

Link:

gist.github.com/saudiwin/986...
Automate the creation of google documents for class
Automate the creation of google documents for class - auto_google_docs.R
gist.github.com
Reposted by W. Joel Schneider
transport-talk.bsky.social
{gm} - Create music with R: flujoo.github.io/gm/

#RStats bookmark from old twitter
w-joel-schneider.bsky.social
Recreating each of the tables in Chapter 7 of the Publication Manual of the American Psychological Association (7th Edition) in R with apa7 (Part 16 of 24)

Featuring two levels of grouping with `flextable::as_grouped_data`

#rstats #apastyle

wjschne.github.io/posts/apatab...
APA-formatted table of regression analyses
w-joel-schneider.bsky.social
Recreating each of the tables in Chapter 7 of the Publication Manual of the American Psychological Association (7th Edition) in R with apa7 (Part 15 of 24)

Featuring automatic formatting of regression analyses

#rstats #apastyle

wjschne.github.io/posts/apatab...
APA-formatted table of a regression analysis
w-joel-schneider.bsky.social
Recreating each of the tables in Chapter 7 of the Publication Manual of the American Psychological Association (7th Edition) in R with apa7 (Part 14 of 24)

Featuring decimal alignment with left-aligned text

#rstats #apastyle

wjschne.github.io/posts/apatab...
APA-formatted table with factor analysis loadings
w-joel-schneider.bsky.social
Recreating each of the tables in Chapter 7 of the Publication Manual of the American Psychological Association (7th Edition) in R with apa7 (Part 13 of 24)

Featuring `column_spanner_label`, which adds a prefix to selected columns

#rstats #apastyle

wjschne.github.io/posts/apatab...
APA-formatted 2-way ANOVAs
w-joel-schneider.bsky.social
Recreating each of the tables in Chapter 7 of the Publication Manual of the American Psychological Association (7th Edition) tables in R with apa7 (Part 12 of 24)

Featuring Selective indentation with `flextable::padding`

#rstats #apastyle

wjschne.github.io/posts/apatab...
APA-formatted table with descriptive statistics and ANOVAs
w-joel-schneider.bsky.social
Recreating each of the tables in Chapter 7 of the Publication Manual of the American Psychological Association (7th Edition) tables in R with apa7 (Part 11 of 24)

Featuring numbered columns and aligned star columns.

#rstats #apastyle

wjschne.github.io/posts/apatab...
APA-formatted correlation matrix
w-joel-schneider.bsky.social
Recreating each of the tables in Chapter 7 of the Publication Manual of the American Psychological Association (7th Edition) tables in R with apa7 (Part 10 of 24)

Featuring correlation matrices and descriptive statistics with `apa_cor`

#rstats #apastyle

wjschne.github.io/posts/apatab...
APA-formatted correlation matrix
w-joel-schneider.bsky.social
Recreating each of the tables in Chapter 7 of the Publication Manual of the American Psychological Association (7th Edition) tables in R with apa7 (Part 9 of 24)

Featuring customizable automatic column formatters

#rstats #apastyle

wjschne.github.io/posts/apatab...
APA-formatted table with descriptive statistics and 1-way ANOVA results
w-joel-schneider.bsky.social
Recreating each of the tables in Chapter 7 of the Publication Manual of the American Psychological Association (7th Edition) tables in R with apa7 (Part 8 of 24)

Featuring intentionally inconsistent rounding within columns

#rstats #apastyle
APA-formatted table of descriptive statistics and t-test results
w-joel-schneider.bsky.social
Recreating each of the tables in Chapter 7 of the Publication Manual of the American Psychological Association (7th Edition) tables in R with apa7 (Part 7 of 24)

Featuring p-values converted to asterisks via `add_star_column`

#rstats #apastyle

wjschne.github.io/posts/apatab...
APA-formatted table with descriptive statistics and chi-square test results.
Reposted by W. Joel Schneider
mzloteanu.bsky.social
#statstab #417 {pwrss} Practical Power Analysis in R

Thoughts: Some useful vignettes for conducting power analyses for various designs, constraints, and data types.

#poweranalysis #samplesize #r #power #guide #tutorial #sesoi #equivalence #tost #rstats

cran.r-project.org/web/packages...
Practical Power Analysis in R
cran.r-project.org
w-joel-schneider.bsky.social
Recreating each of the tables in Chapter 7 of the Publication Manual of the American Psychological Association (7th Edition) tables in R with apa7 (Part 6 of 24)

Featuring columns centered on a space character.

#rstats #apastyle

wjschne.github.io/posts/apatab...
APA-formatted table showing descriptive statistics
Reposted by W. Joel Schneider
mattansb.msbstats.info
New blog post!

Ever wonder what geom_histogram is actually doing? How about geom_boxplot?

In celebration of the release of #ggplot2 4.0.0 (ggplot8?), I explore the relationships between the “geoms” and “stats” offered by the core {ggplot2} functions.

#rstats
Exploring {ggplot2}’s Geoms and Stats – Stat’s What It’s All About
blog.msbstats.info