
William F. Lamb
@wflamb.bsky.social
7.2K followers
2.6K following
110 posts
Climate policy researcher at the Potsdam Institute for Climate Impact Research. I work on emissions trends, policy evaluation, carbon dioxide removal and climate obstruction. Scot in Deutschland. https://lambwf.github.io/
Posts
Media
Videos
Starter Packs
Reposted by William F. Lamb


Reposted by William F. Lamb
Reposted by William F. Lamb

Reposted by William F. Lamb
PIK_climate
@pik-potsdam.bsky.social
· Jun 23

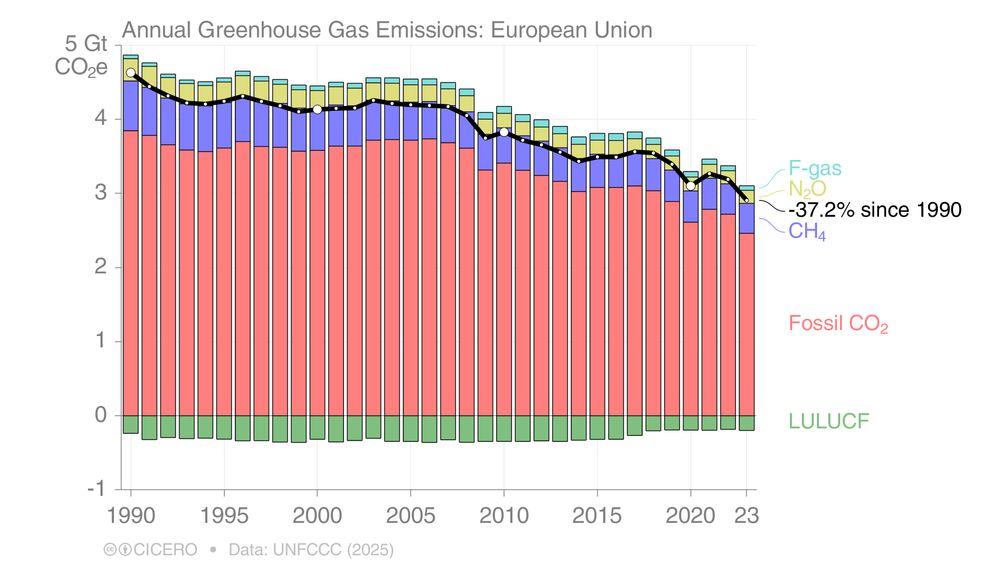
Höhepunkt der CO2-Emissionen noch nicht erreicht
Während Delegierte aus aller Welt in Bonn die nächste Klimakonferenz vorbereiten, offenbart ein neuer Bericht die fragile Lage des Weltklimas. Die Forderungen nach einem Umsteuern werden immer lauter....
www.tagesschau.de
William F. Lamb
@wflamb.bsky.social
· Jun 16


Reposted by William F. Lamb

Reposted by William F. Lamb

Reposted by William F. Lamb
Chris Smith
@cjsmith.be
· Apr 24
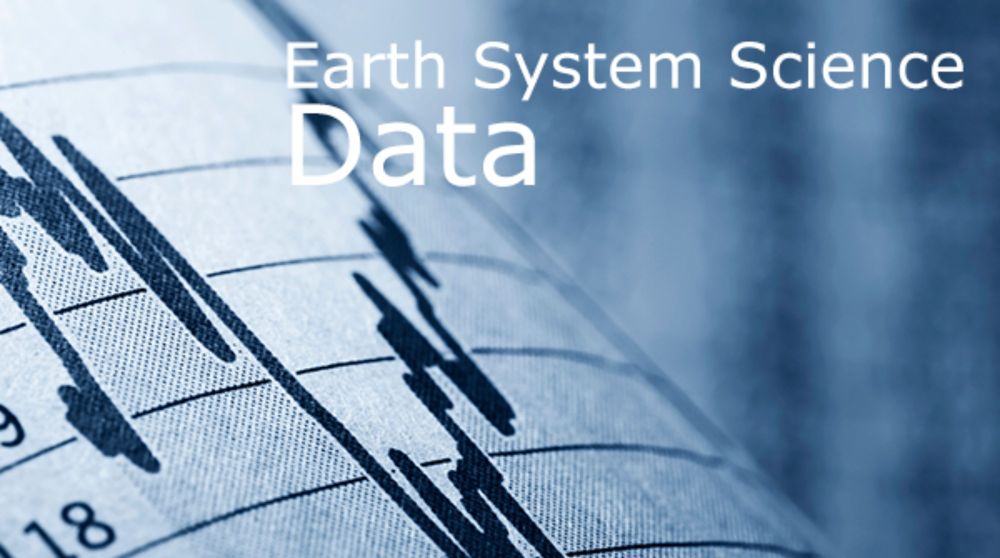
Differences in anthropogenic greenhouse gas emissions estimates explained
Abstract. We examine differences in global and national greenhouse gas (GHG) emissions estimates and highlight the important role of varying system boundaries and conceptual approaches in driving thes...
essd.copernicus.org
Reposted by William F. Lamb

Reposted by William F. Lamb
Sharon Lerner
@fastlerner.bsky.social
· Apr 16

Trump’s EPA Plans to Stop Collecting Greenhouse Gas Emissions Data From Most Polluters
Climate experts expressed shock and dismay at the move. “It would be a bit like unplugging the equipment that monitors the vital signs of a patient that is critically ill,” one said.
www.propublica.org
William F. Lamb
@wflamb.bsky.social
· Apr 16


William F. Lamb
@wflamb.bsky.social
· Apr 16

Global carbon emissions and decarbonization in 2024 - Nature Reviews Earth & Environment
Global CO2 emissions in 2024 increased 0.9% on the previous year, totalling 36.3 Gt CO2. These ongoing emissions further deplete remaining carbon budgets, with some estimates suggesting the 1.5 °C bud...
www.nature.com


Reposted by William F. Lamb

Dave Vetter
@davidrvetter.bsky.social
· Apr 8