


Dan Kleinman
@dankleinman.bsky.social
Research scientist at Yale Child Study Center (formerly Haskins Labs). PhD. Interested in language, dyslexia, bilingualism, EEG, stats. Proponent of summary limericks. I probably drink more tea than you. Posts are ~50% science; opinions are 100% my own.
Pinned
Dan Kleinman
@dankleinman.bsky.social
· Nov 13
I study language-related topics including dyslexia and bilingual language switching, and post mainly about science, wordplay, and tea. I follow academics, journalists, and anyone who knows a lot about a topic and isn’t afraid to show it (lawyers, music theorists). Always happy to learn new things!
This is so good, it almost makes me want to solve some cryptic crosswords. (Almost.)

Gonna spoil this now! (No. 304)
The “revealer” answer is SONNET [Young fellow make the thing we’ve written here] (6)
Me: “What do you mean? How have you written a sonnet?” Me: ten seconds later: “hoooly shit”
(clues=perfect Shakespearean sonnet, and somehow every clue also works perfectly…unreal)
The “revealer” answer is SONNET [Young fellow make the thing we’ve written here] (6)
Me: “What do you mean? How have you written a sonnet?” Me: ten seconds later: “hoooly shit”
(clues=perfect Shakespearean sonnet, and somehow every clue also works perfectly…unreal)
February 11, 2026 at 2:25 PM
This is so good, it almost makes me want to solve some cryptic crosswords. (Almost.)
Reposted by Dan Kleinman

This is good news for NIH-funded behavioral scientists and for the public; it resolves an unfortunate Catch-22 situation that inflated administrative burden and occasionally excluded basic behavioral science from funding opportunities:
grants.nih.gov/grants/guide...
grants.nih.gov/grants/guide...
NOT-OD-26-032: Basic Experimental Studies in Humans (BESH) Will No Longer Be Considered Clinical Trials by the NIH
NIH Funding Opportunities and Notices in the NIH Guide for Grants and Contracts: Basic Experimental Studies in Humans (BESH) Will No Longer Be Considered Clinical Trials by the NIH NOT-OD-26-032. NIH
grants.nih.gov
January 29, 2026 at 4:14 PM
This is good news for NIH-funded behavioral scientists and for the public; it resolves an unfortunate Catch-22 situation that inflated administrative burden and occasionally excluded basic behavioral science from funding opportunities:
grants.nih.gov/grants/guide...
grants.nih.gov/grants/guide...
A nice thread on the importance of humility (and quantifying uncertainty) in research.
I’m reminded of own experience in publishing my first paper, which changed the way I review manuscripts.
I’m reminded of own experience in publishing my first paper, which changed the way I review manuscripts.
At the first small conference I got invited to when I stated teaching, I met someone I had always thought was a Really Big Deal when I was in grad school.
My first big paper had just come out, and it had contradicted (w data) some central claims this guy had made for years (w anecdotes).
My first big paper had just come out, and it had contradicted (w data) some central claims this guy had made for years (w anecdotes).

I'd rather burn this place down than admit I was incorrect about something
Trump 🤝 bluesky
Trump 🤝 bluesky
January 30, 2026 at 2:44 PM
A nice thread on the importance of humility (and quantifying uncertainty) in research.
I’m reminded of own experience in publishing my first paper, which changed the way I review manuscripts.
I’m reminded of own experience in publishing my first paper, which changed the way I review manuscripts.
Glad to see the Psychonomic Society starting up a journal with a focus on individual differences! Although as a general rule, if it's important to clarify how people should pronounce your new acronym... you should consider choosing another acronym.

December 17, 2025 at 1:11 AM
Glad to see the Psychonomic Society starting up a journal with a focus on individual differences! Although as a general rule, if it's important to clarify how people should pronounce your new acronym... you should consider choosing another acronym.
Thrilled to see universal dyslexia screeners rolled out for CA kids in grades K-2. Early identification is so important.

Signs of dyslexia and reading troubles can be spotted in kindergarten — or even preschool
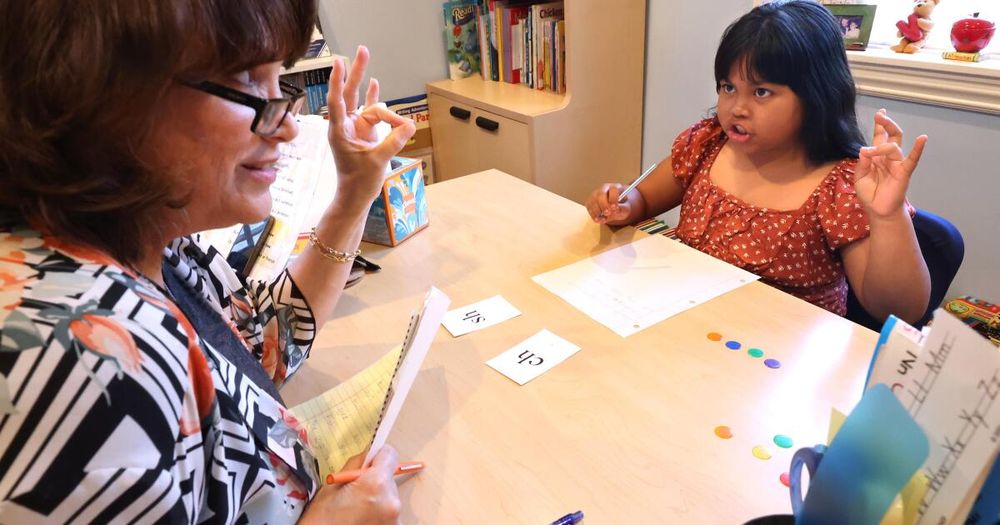
Signs of dyslexia and reading troubles can be spotted in kindergarten — or even preschool
California schools will begin screening kindergartners and first- and second- graders for dyslexia to combat the state's low early reading scores.
www.latimes.com
October 7, 2025 at 4:51 PM
Thrilled to see universal dyslexia screeners rolled out for CA kids in grades K-2. Early identification is so important.
Me: It's nice not having a lot of meetings these days!
Zoom: You were saying...?
Zoom: You were saying...?

September 3, 2025 at 2:30 PM
Me: It's nice not having a lot of meetings these days!
Zoom: You were saying...?
Zoom: You were saying...?
This is a nice description of what I call “passing the smell test”. Fancy stats can be very useful (I occasionally rely on them!), but it’s critical to look for converging evidence that an effect is “real” rather than blindly trusting the results of a model (which could be misspecified).

August 15, 2025 at 6:07 PM
This is a nice description of what I call “passing the smell test”. Fancy stats can be very useful (I occasionally rely on them!), but it’s critical to look for converging evidence that an effect is “real” rather than blindly trusting the results of a model (which could be misspecified).
Read a paper the other day from the early 1990s which reported an in-depth analysis of reading/writing/spelling errors made by 6 students. The main focus of the paper was the detailed coding scheme used to classify the errors. But! – there was also a statistical analysis comparing their performance.
August 8, 2025 at 4:18 PM
Read a paper the other day from the early 1990s which reported an in-depth analysis of reading/writing/spelling errors made by 6 students. The main focus of the paper was the detailed coding scheme used to classify the errors. But! – there was also a statistical analysis comparing their performance.
In "news that will be very exciting to a small group of people", I discovered today that – a full decade after I first wished for this feature – it is now possible to read JMP files into R!

August 6, 2025 at 3:56 PM
In "news that will be very exciting to a small group of people", I discovered today that – a full decade after I first wished for this feature – it is now possible to read JMP files into R!
@nytxworeo.bsky.social is going to have a very exciting day tomorrow
July 30, 2025 at 3:53 AM
@nytxworeo.bsky.social is going to have a very exciting day tomorrow
On board my flight to #SSSR2025. The flight attendant gave instructions to the emergency exit row passengers in front of me and asked if they had any questions. One did: “How do I know when to open the door?”
Hopefully I make it to Calgary in one piece…!
Hopefully I make it to Calgary in one piece…!
July 16, 2025 at 6:38 PM
On board my flight to #SSSR2025. The flight attendant gave instructions to the emergency exit row passengers in front of me and asked if they had any questions. One did: “How do I know when to open the door?”
Hopefully I make it to Calgary in one piece…!
Hopefully I make it to Calgary in one piece…!
I started explicitly thinking about scientific research this way after seeing Jeff Rouder talk about it at Psychonomics. One of many benefits: It takes pressure off of RAs (who have heard me talk about this).

1/5 For upcoming work I lately read some articles on handling mistakes in science. They share an important consensus I think everyone should know:
Mistakes are a failure of systems, not people. In a working system, making a mistake is normal, but inconsequential. 🧵
Mistakes are a failure of systems, not people. In a working system, making a mistake is normal, but inconsequential. 🧵
July 14, 2025 at 10:06 PM
I started explicitly thinking about scientific research this way after seeing Jeff Rouder talk about it at Psychonomics. One of many benefits: It takes pressure off of RAs (who have heard me talk about this).
One of my favorite bands is crowdfunding to release a new double album. I kicked in to get a digital copy, but was gobsmacked by this singular perk, which awaits a very rich superfan. The FAQ includes this gem: "Q: Is the "Fateful Choice" incentive real? A: We dare you."

July 9, 2025 at 8:27 PM
One of my favorite bands is crowdfunding to release a new double album. I kicked in to get a digital copy, but was gobsmacked by this singular perk, which awaits a very rich superfan. The FAQ includes this gem: "Q: Is the "Fateful Choice" incentive real? A: We dare you."
I will not feel strangely compelled to come to the defense of a for-profit scientific publishing company. I will not feel strangely compelled to come to the defense of a for-profit scientific publishing company. I will not feel strangely compelled to come to the defense of a for-profit scientific pu

Sources: Trump administration terminated millions in subscriptions for Springer Nature, after earlier accusing it of acting as a partisan in scientific debates (Axios)
Main Link | Mediagazer Permalink
Main Link | Mediagazer Permalink
June 25, 2025 at 1:48 PM
I will not feel strangely compelled to come to the defense of a for-profit scientific publishing company. I will not feel strangely compelled to come to the defense of a for-profit scientific publishing company. I will not feel strangely compelled to come to the defense of a for-profit scientific pu
Reposted by Dan Kleinman
BREAKING: A federal judge in Massachusetts (the Reagan-appointed William Young) has declared the Trump administration's cuts to NIH grants — ostensibly over Trump's EOs on gender ideology and DEI — are "illegal" and "void." He's ordering many grants restored.
June 16, 2025 at 6:23 PM
BREAKING: A federal judge in Massachusetts (the Reagan-appointed William Young) has declared the Trump administration's cuts to NIH grants — ostensibly over Trump's EOs on gender ideology and DEI — are "illegal" and "void." He's ordering many grants restored.
Reposted by Dan Kleinman

Check out our preprint (linked again here: osf.io/preprints/ps...) where we measured neural sensitivity to changes in semantic space while listening to a podcast. Not only do we look at word-to-word but larger chunks too (2-gram, 5-gram, 10-gram) to examine meaning construction at multiple levels.

June 13, 2025 at 8:33 PM
Check out our preprint (linked again here: osf.io/preprints/ps...) where we measured neural sensitivity to changes in semantic space while listening to a podcast. Not only do we look at word-to-word but larger chunks too (2-gram, 5-gram, 10-gram) to examine meaning construction at multiple levels.
This sounds like a dystopian version of the classic Loftus & Palmer experiment: “How fast was Sen. Padilla moving when he {ran at, lunged at, bum-rushed, posed a question to} Secretary Noem?”

Fox hosts, parroting DHS, claimed Sen. Padilla "ran at,” "lunged at," and tried to “bum-rush” Kristi Noem. Video disproves their claims, showing Padilla standing calmly across the room asking his question as security grabs him.
June 13, 2025 at 10:00 PM
This sounds like a dystopian version of the classic Loftus & Palmer experiment: “How fast was Sen. Padilla moving when he {ran at, lunged at, bum-rushed, posed a question to} Secretary Noem?”
Reposted by Dan Kleinman

Very last minute - but check out this workshop happening this Thursday and Friday on how we might build theories that account for variability and universality in human minds and brains. Remote attendence is an option! cps-vo.org/group/cise-s...
2025 NSF-Jacobs Foundation workshop on Deconstructing the Universal Mind | Cyber-Physical Systems Virtual Organization
cps-vo.org
June 10, 2025 at 9:30 PM
Very last minute - but check out this workshop happening this Thursday and Friday on how we might build theories that account for variability and universality in human minds and brains. Remote attendence is an option! cps-vo.org/group/cise-s...
Reposted by Dan Kleinman

the nytimes doesn't get LA and never will

June 9, 2025 at 3:37 AM
the nytimes doesn't get LA and never will
It's one thing to look at my calendar and realize it's relatively meeting-free. It's another thing to discover that the microphone I use for Zoom meetings at home is the centerpiece of an elaborate cobweb built by an enterprising spider.
June 5, 2025 at 3:21 PM
It's one thing to look at my calendar and realize it's relatively meeting-free. It's another thing to discover that the microphone I use for Zoom meetings at home is the centerpiece of an elaborate cobweb built by an enterprising spider.
“Data Thug” James Heathers and the center behind Retraction Watch have launched a project to root out fraudulent medical studies which bias meta-analyses and lead to flawed medical guidance and (thus) deaths. They have the expertise & the funding — can’t wait to see what horrible things they find!

Friends, I have news.
It is very good news.
You'll just have to read it, I'm afraid.
jamesclaims.substack.com/p/introducin...
It is very good news.
You'll just have to read it, I'm afraid.
jamesclaims.substack.com/p/introducin...

Introducing the Medical Evidence Project
And the quest to make less dead people
jamesclaims.substack.com
June 4, 2025 at 1:58 PM
“Data Thug” James Heathers and the center behind Retraction Watch have launched a project to root out fraudulent medical studies which bias meta-analyses and lead to flawed medical guidance and (thus) deaths. They have the expertise & the funding — can’t wait to see what horrible things they find!
Reposted by Dan Kleinman

A 23-Year-Old Crypto Bro Is Now Vetoing NSF Grants While Staring At His Water Bottle
Picture this: You're a researcher who has spent years developing a grant proposal, gone through layers of expert review, and received National Science Foundation (NSF) approval. Then some kid barely out of college…
Picture this: You're a researcher who has spent years developing a grant proposal, gone through layers of expert review, and received National Science Foundation (NSF) approval. Then some kid barely out of college…
A 23-Year-Old Crypto Bro Is Now Vetoing NSF Grants While Staring At His Water Bottle
Picture this: You're a researcher who has spent years developing a grant proposal, gone through layers of expert review, and received National Science Foundation (NSF) approval. Then some kid barely out of college — whose main qualification appears to be founding a company that puts ads on the blockchain — logs into a Zoom meeting, pays more attention to his fingernails than the discussion, and kills your grant with a disinterested thumbs down.
www.techdirt.com
June 2, 2025 at 4:22 PM
A 23-Year-Old Crypto Bro Is Now Vetoing NSF Grants While Staring At His Water Bottle
Picture this: You're a researcher who has spent years developing a grant proposal, gone through layers of expert review, and received National Science Foundation (NSF) approval. Then some kid barely out of college…
Picture this: You're a researcher who has spent years developing a grant proposal, gone through layers of expert review, and received National Science Foundation (NSF) approval. Then some kid barely out of college…
Reposted by Dan Kleinman

The EO has to be interpreted in light of the (decades long) Republican attack on science.
This has nothing to do with improving science. They're using legitImate criticism from within science to (ironically) decrease the credibility of science. They then have no obligation to listen to scientists.
This has nothing to do with improving science. They're using legitImate criticism from within science to (ironically) decrease the credibility of science. They then have no obligation to listen to scientists.
There is a new Executive Order that is closely related to many of the topics promoted in the science reform movement. It deserves a close read as it will surely have implications for how some promoted reforms are implemented in policy and practice. My hot take 🧵
www.whitehouse.gov/presidential...
www.whitehouse.gov/presidential...

Restoring Gold Standard Science
By the authority vested in me as President by the Constitution and the laws of the United States of America, including section 7301 of title 5, United
www.whitehouse.gov
May 24, 2025 at 12:26 PM
The EO has to be interpreted in light of the (decades long) Republican attack on science.
This has nothing to do with improving science. They're using legitImate criticism from within science to (ironically) decrease the credibility of science. They then have no obligation to listen to scientists.
This has nothing to do with improving science. They're using legitImate criticism from within science to (ironically) decrease the credibility of science. They then have no obligation to listen to scientists.
I get a lot of spam from fake journals, but this one — which has a… unique subject line; has no journal title (only an acronym, here redacted); and for which the main argument seems to be that my submission within 24 hours would improve the sender’s (“my”) ranking — managed to set itself apart.
![An email with some names redacted. Subject line: “Shower us with your precious article”. Body: “Hi [redacted], To support [redacted], we kindly request you to submit your article within the next 24 hours. Your prompt submission will also contribute to my ranking this month.”](https://cdn.bsky.app/img/feed_thumbnail/plain/did:plc:i3sq6zfcvzshxha3w3bifzzu/bafkreigx42i5zdspor3s5ou5yisygf5bazubkz7utg62rvhsaryxjoxdl4@jpeg)
May 6, 2025 at 1:28 PM
I get a lot of spam from fake journals, but this one — which has a… unique subject line; has no journal title (only an acronym, here redacted); and for which the main argument seems to be that my submission within 24 hours would improve the sender’s (“my”) ranking — managed to set itself apart.