


Guillaume Noblet
@gnoblet.bsky.social
(he/him)
🔛 Now: humanitarian research #rstats #dataviz
🔙 Research on agricultural economics & history of statistics
🕸️ https://guillaume-noblet.com
🔛 Now: humanitarian research #rstats #dataviz
🔙 Research on agricultural economics & history of statistics
🕸️ https://guillaume-noblet.com
Pinned
Guillaume Noblet
@gnoblet.bsky.social
· Sep 22

🚀 Just released **ggbranding** (v1) – a tiny R package that lets you brand `ggplot2` charts with Font Awesome 7 icons.
📝 Blog: gnoblet.github.io/blog/ggbrand...
💻 Code: github.com/gnoblet/ggbr...
#opensource #branding #package #rstats #dataviz #ggplot2
📝 Blog: gnoblet.github.io/blog/ggbrand...
💻 Code: github.com/gnoblet/ggbr...
#opensource #branding #package #rstats #dataviz #ggplot2
Reposted by Guillaume Noblet

dplyr 1.2.0 is out now and we are SO excited!
- `filter_out()` for dropping rows
- `recode_values()`, `replace_values()`, and `replace_when()` that join `case_when()` as a complete family of recoding/replacing tools
These are huge quality of life wins for #rstats!
tidyverse.org/blog/2026/02...
- `filter_out()` for dropping rows
- `recode_values()`, `replace_values()`, and `replace_when()` that join `case_when()` as a complete family of recoding/replacing tools
These are huge quality of life wins for #rstats!
tidyverse.org/blog/2026/02...

dplyr 1.2.0
dplyr 1.2.0 fills in some important gaps in dplyr's API: we've added a new complement to `filter()` focused on dropping rows, and we've expanded the `case_when()` family with three new recoding and re...
tidyverse.org
February 4, 2026 at 11:39 AM
dplyr 1.2.0 is out now and we are SO excited!
- `filter_out()` for dropping rows
- `recode_values()`, `replace_values()`, and `replace_when()` that join `case_when()` as a complete family of recoding/replacing tools
These are huge quality of life wins for #rstats!
tidyverse.org/blog/2026/02...
- `filter_out()` for dropping rows
- `recode_values()`, `replace_values()`, and `replace_when()` that join `case_when()` as a complete family of recoding/replacing tools
These are huge quality of life wins for #rstats!
tidyverse.org/blog/2026/02...
Reposted by Guillaume Noblet

Nouvel épisode de « 4e pouvoir », l’émission vidéo d’Acrimed chez @blast-info.fr 👇

1995-2025 : les médias contre les mouvements sociaux (vidéo)
Acrimed sur Blast.
www.acrimed.org
December 28, 2025 at 5:16 PM
Nouvel épisode de « 4e pouvoir », l’émission vidéo d’Acrimed chez @blast-info.fr 👇
Reposted by Guillaume Noblet

[tw divers] Pour Noël j'ai eu un livre sur la prison ("Perpétuité" de G. Poix), un livre sur les violences sexuelles ("Le viol, notre culture" de B. Hamidi) et un avec des nazis ("Une ascension" de S. Hertmans)
Ça me va très bien, mais je crois que VA avait raison, je casse l'ambiance en soirée.
Ça me va très bien, mais je crois que VA avait raison, je casse l'ambiance en soirée.
December 28, 2025 at 5:21 PM
[tw divers] Pour Noël j'ai eu un livre sur la prison ("Perpétuité" de G. Poix), un livre sur les violences sexuelles ("Le viol, notre culture" de B. Hamidi) et un avec des nazis ("Une ascension" de S. Hertmans)
Ça me va très bien, mais je crois que VA avait raison, je casse l'ambiance en soirée.
Ça me va très bien, mais je crois que VA avait raison, je casse l'ambiance en soirée.
Reposted by Guillaume Noblet

J'ai ma réponse : le 19 novembre 2025...

November 21, 2025 at 7:39 PM
J'ai ma réponse : le 19 novembre 2025...
Reposted by Guillaume Noblet

Congratulations to my student, Maggie Ma, for publishing her first #rstats package {ggincerta} on CRAN 🥳
Spatial uncertainty visualisation (bivariate, pixel, exceedance, glyph), like {Vizumap}, but fully integrated with ggplot2 -- a much simpler API with all the advantages of the ggplot2 system.
Spatial uncertainty visualisation (bivariate, pixel, exceedance, glyph), like {Vizumap}, but fully integrated with ggplot2 -- a much simpler API with all the advantages of the ggplot2 system.


November 16, 2025 at 4:51 AM
Congratulations to my student, Maggie Ma, for publishing her first #rstats package {ggincerta} on CRAN 🥳
Spatial uncertainty visualisation (bivariate, pixel, exceedance, glyph), like {Vizumap}, but fully integrated with ggplot2 -- a much simpler API with all the advantages of the ggplot2 system.
Spatial uncertainty visualisation (bivariate, pixel, exceedance, glyph), like {Vizumap}, but fully integrated with ggplot2 -- a much simpler API with all the advantages of the ggplot2 system.
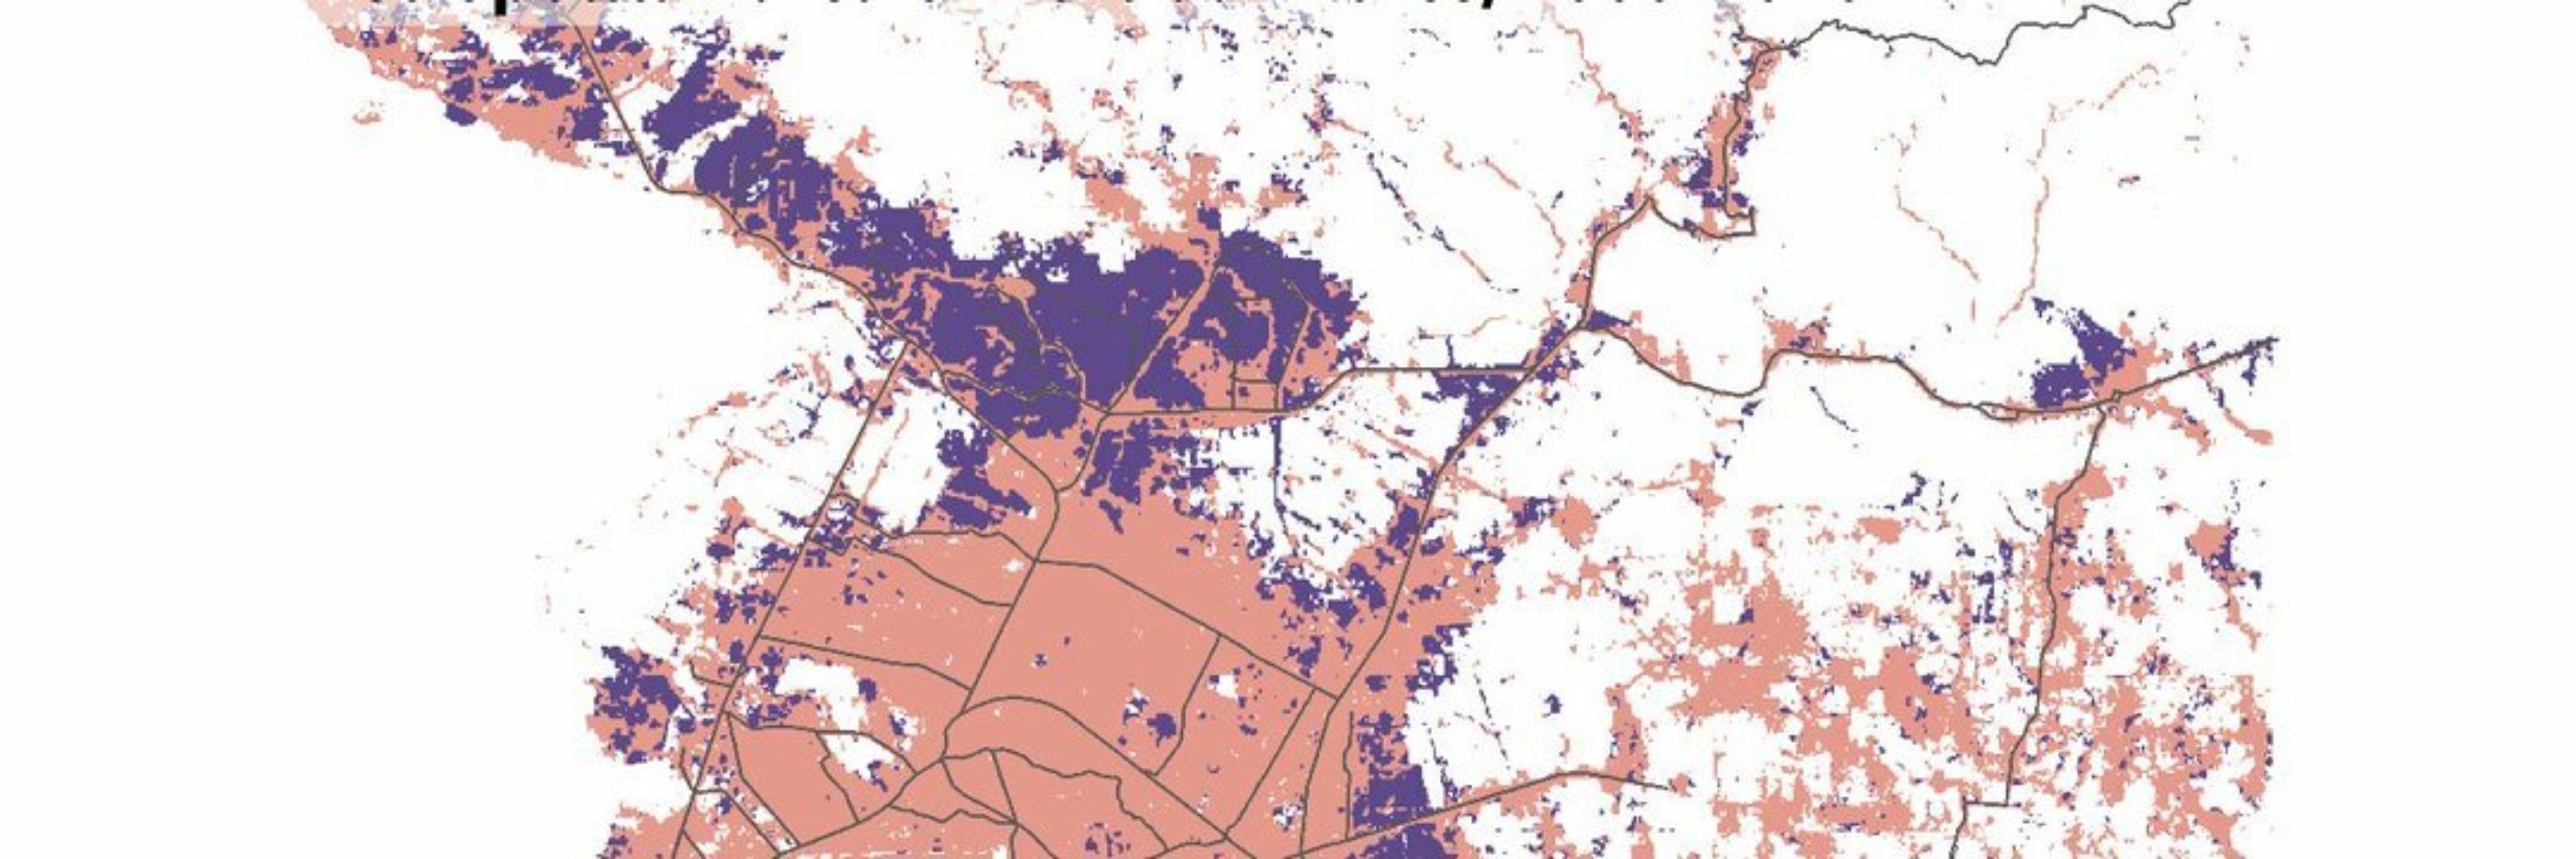
Days 08 and 11 of #30DayMapChallenge bridged into one: I minimally represented urbanism via the non-urban fabric of the Geneva area. Decided it was minimal although not that much.
Code: guillaume-noblet.com/30DayMapChal...
#ggplot2 #dataviz #maps #rstats
Code: guillaume-noblet.com/30DayMapChal...
#ggplot2 #dataviz #maps #rstats

November 12, 2025 at 7:55 AM
Days 08 and 11 of #30DayMapChallenge bridged into one: I minimally represented urbanism via the non-urban fabric of the Geneva area. Decided it was minimal although not that much.
Code: guillaume-noblet.com/30DayMapChal...
#ggplot2 #dataviz #maps #rstats
Code: guillaume-noblet.com/30DayMapChal...
#ggplot2 #dataviz #maps #rstats
#Day07 of #30DayMapChallenge on Accessibility
This map shows the time needed to cycle from Bains des Paquis (a popular fondue and sauna place in Geneva)
🆕 1st time use of the `osmr` package to define #isochrones.
Gallery: guillaume-noblet.com/30DayMapChal...
#dataviz #rstats #ggplot2 #gis #map
This map shows the time needed to cycle from Bains des Paquis (a popular fondue and sauna place in Geneva)
🆕 1st time use of the `osmr` package to define #isochrones.
Gallery: guillaume-noblet.com/30DayMapChal...
#dataviz #rstats #ggplot2 #gis #map

November 11, 2025 at 10:41 AM
#Day07 of #30DayMapChallenge on Accessibility
This map shows the time needed to cycle from Bains des Paquis (a popular fondue and sauna place in Geneva)
🆕 1st time use of the `osmr` package to define #isochrones.
Gallery: guillaume-noblet.com/30DayMapChal...
#dataviz #rstats #ggplot2 #gis #map
This map shows the time needed to cycle from Bains des Paquis (a popular fondue and sauna place in Geneva)
🆕 1st time use of the `osmr` package to define #isochrones.
Gallery: guillaume-noblet.com/30DayMapChal...
#dataviz #rstats #ggplot2 #gis #map
For Day 06 of the #30DayMapChallenge, I used:
📖 Wikipedia retrieving tallest building list with `rvest`
🏔️ `tidyterra` to retrieve elevation shades
🔮 Refined top buildings's labels and lines with `ggrepel`
Code: guillaume-noblet.com/30DayMapChal...
#rstats #gis #dataviz #ggplot2 #terra
📖 Wikipedia retrieving tallest building list with `rvest`
🏔️ `tidyterra` to retrieve elevation shades
🔮 Refined top buildings's labels and lines with `ggrepel`
Code: guillaume-noblet.com/30DayMapChal...
#rstats #gis #dataviz #ggplot2 #terra

November 8, 2025 at 3:52 PM
For Day 06 of the #30DayMapChallenge, I used:
📖 Wikipedia retrieving tallest building list with `rvest`
🏔️ `tidyterra` to retrieve elevation shades
🔮 Refined top buildings's labels and lines with `ggrepel`
Code: guillaume-noblet.com/30DayMapChal...
#rstats #gis #dataviz #ggplot2 #terra
📖 Wikipedia retrieving tallest building list with `rvest`
🏔️ `tidyterra` to retrieve elevation shades
🔮 Refined top buildings's labels and lines with `ggrepel`
Code: guillaume-noblet.com/30DayMapChal...
#rstats #gis #dataviz #ggplot2 #terra
Day 05 of #30DayMapChallenge on Earth (Classical Elements 1/4)
I've discovered and used the new `tmap.mapgl` to show Swizerland's elevation. It's mindblowing how easy it is.
guillaume-noblet.com/30DayMapChal...
#dataviz #rstats #tmap #gis #mapgl cc @mtennekes and thanks!
I've discovered and used the new `tmap.mapgl` to show Swizerland's elevation. It's mindblowing how easy it is.
guillaume-noblet.com/30DayMapChal...
#dataviz #rstats #tmap #gis #mapgl cc @mtennekes and thanks!
November 7, 2025 at 12:30 PM
Day 05 of #30DayMapChallenge on Earth (Classical Elements 1/4)
I've discovered and used the new `tmap.mapgl` to show Swizerland's elevation. It's mindblowing how easy it is.
guillaume-noblet.com/30DayMapChal...
#dataviz #rstats #tmap #gis #mapgl cc @mtennekes and thanks!
I've discovered and used the new `tmap.mapgl` to show Swizerland's elevation. It's mindblowing how easy it is.
guillaume-noblet.com/30DayMapChal...
#dataviz #rstats #tmap #gis #mapgl cc @mtennekes and thanks!
Reposted by Guillaume Noblet

Interesting & nice chart!. Similar idea to what I use in #rstats
vcd::fourfold()
- but uses quarter circles, with CI rings for the odds ratio.
- signif OR !=1 \equiv quarter circles DON'T OVERLAP
vcd::fourfold()
- but uses quarter circles, with CI rings for the odds ratio.
- signif OR !=1 \equiv quarter circles DON'T OVERLAP


November 6, 2025 at 3:39 AM
Interesting & nice chart!. Similar idea to what I use in #rstats
vcd::fourfold()
- but uses quarter circles, with CI rings for the odds ratio.
- signif OR !=1 \equiv quarter circles DON'T OVERLAP
vcd::fourfold()
- but uses quarter circles, with CI rings for the odds ratio.
- signif OR !=1 \equiv quarter circles DON'T OVERLAP
I did publish Day 04 of #30DayMapChallenge on a Microsoft owned platform too! With a bit of tweaking the theme.
Code: guillaume-noblet.com/30DayMapChal...
#rstats #dataviz #map #ggplot2 #gis #fedora
Code: guillaume-noblet.com/30DayMapChal...
#rstats #dataviz #map #ggplot2 #gis #fedora

November 6, 2025 at 10:21 AM
I did publish Day 04 of #30DayMapChallenge on a Microsoft owned platform too! With a bit of tweaking the theme.
Code: guillaume-noblet.com/30DayMapChal...
#rstats #dataviz #map #ggplot2 #gis #fedora
Code: guillaume-noblet.com/30DayMapChal...
#rstats #dataviz #map #ggplot2 #gis #fedora
Day 03 of #30DayMapChallenge with a density choropleth and quantiles!
👏 Thanks to @Benjamin Novak's tutorial in @yan-holtz.bsky.social gallery r-graph-gallery.com/web-map-chor...
🌚 Used data from the Observatoire Statistique Tranfrontalier
#rstats #dataviz #map #ggplot2 #gis
👏 Thanks to @Benjamin Novak's tutorial in @yan-holtz.bsky.social gallery r-graph-gallery.com/web-map-chor...
🌚 Used data from the Observatoire Statistique Tranfrontalier
#rstats #dataviz #map #ggplot2 #gis

November 5, 2025 at 3:14 PM
Day 03 of #30DayMapChallenge with a density choropleth and quantiles!
👏 Thanks to @Benjamin Novak's tutorial in @yan-holtz.bsky.social gallery r-graph-gallery.com/web-map-chor...
🌚 Used data from the Observatoire Statistique Tranfrontalier
#rstats #dataviz #map #ggplot2 #gis
👏 Thanks to @Benjamin Novak's tutorial in @yan-holtz.bsky.social gallery r-graph-gallery.com/web-map-chor...
🌚 Used data from the Observatoire Statistique Tranfrontalier
#rstats #dataviz #map #ggplot2 #gis
Day 02 of #30DayMapChallenge with a few Swiss river lines
🙏 Followed @milos-makes-maps.bsky.social's tutorial
🆕 Added a halo layer under the lines layer
✨ 1st time I plotted a river system
#ggplot2 #rstats #dataviz #maps
🙏 Followed @milos-makes-maps.bsky.social's tutorial
🆕 Added a halo layer under the lines layer
✨ 1st time I plotted a river system
#ggplot2 #rstats #dataviz #maps

November 4, 2025 at 8:52 AM
Day 02 of #30DayMapChallenge with a few Swiss river lines
🙏 Followed @milos-makes-maps.bsky.social's tutorial
🆕 Added a halo layer under the lines layer
✨ 1st time I plotted a river system
#ggplot2 #rstats #dataviz #maps
🙏 Followed @milos-makes-maps.bsky.social's tutorial
🆕 Added a halo layer under the lines layer
✨ 1st time I plotted a river system
#ggplot2 #rstats #dataviz #maps
Reposted by Guillaume Noblet


November 2, 2025 at 12:38 PM
#30DayMapChallenge Here is day 01, showing road accidents in Geneva, Switzerland.
#DataViz #RStats #ggplot2
#DataViz #RStats #ggplot2

November 3, 2025 at 12:55 PM
#30DayMapChallenge Here is day 01, showing road accidents in Geneva, Switzerland.
#DataViz #RStats #ggplot2
#DataViz #RStats #ggplot2
Reposted by Guillaume Noblet

Âgé de 31 ans, il a quitté l’enclave palestinienne en 2018 pour rejoindre son frère basé en France. Mais depuis, il n’a pu obtenir ni l’asile ni un droit au séjour. Pire, il est menacé d’expulsion malgré le contexte de la guerre génocidaire menée par Israël.
Par Nejma Brahim
Par Nejma Brahim

Dans les Vosges, Yasin, un Palestinien de Gaza, doit se battre contre les OQTF
Âgé de 31 ans, il a quitté l’enclave palestinienne en 2018 pour rejoindre son frère basé en France. Mais depuis, il n’a pu obtenir ni l’asile ni un droit au séjour. Pire, il est menacé d’expulsion malgré le contexte de la guerre génocidaire menée par Israël.
l.mediapart.fr
October 25, 2025 at 7:11 PM
Âgé de 31 ans, il a quitté l’enclave palestinienne en 2018 pour rejoindre son frère basé en France. Mais depuis, il n’a pu obtenir ni l’asile ni un droit au séjour. Pire, il est menacé d’expulsion malgré le contexte de la guerre génocidaire menée par Israël.
Par Nejma Brahim
Par Nejma Brahim
Reposted by Guillaume Noblet

Malgré le cessez-le-feu, l'aide humanitaire arrive tjs au compte-goutte à Gaza
Et Israël peut toujours compter sur les livraisons 🇫🇷de composants pour ses armes
Avec @antoinehasday.bsky.social on révèle un nouveau colis pour drones Hermes prévu le 20/10
disclose.ngo/fr/article/v...
Et Israël peut toujours compter sur les livraisons 🇫🇷de composants pour ses armes
Avec @antoinehasday.bsky.social on révèle un nouveau colis pour drones Hermes prévu le 20/10
disclose.ngo/fr/article/v...

Vente d'armes : livraison imminente de matériel français vers Israël
Une semaine après la signature du cessez-le-feu entre Israël et le Hamas, Disclose révèle qu’un lot de matériel fabriqué par la société française Sermat doit être expédié en Israël, lundi 20 octobre. ...
disclose.ngo
October 17, 2025 at 10:14 AM
Malgré le cessez-le-feu, l'aide humanitaire arrive tjs au compte-goutte à Gaza
Et Israël peut toujours compter sur les livraisons 🇫🇷de composants pour ses armes
Avec @antoinehasday.bsky.social on révèle un nouveau colis pour drones Hermes prévu le 20/10
disclose.ngo/fr/article/v...
Et Israël peut toujours compter sur les livraisons 🇫🇷de composants pour ses armes
Avec @antoinehasday.bsky.social on révèle un nouveau colis pour drones Hermes prévu le 20/10
disclose.ngo/fr/article/v...
#TidyTuesday this week is about the #FAO data for the #WorldFoodDay
📊 Combining `ggbump` and a map to display a ranking, I chose to use IPC data instead and reproduce a chart by David Sjoberg.
#rstats #ipcinfo #ipc #fsl #dataviz #map #ggplot2
Code: guillaume-noblet.com/TidyTuesday/
📊 Combining `ggbump` and a map to display a ranking, I chose to use IPC data instead and reproduce a chart by David Sjoberg.
#rstats #ipcinfo #ipc #fsl #dataviz #map #ggplot2
Code: guillaume-noblet.com/TidyTuesday/

October 15, 2025 at 2:42 PM
#TidyTuesday this week is about the #FAO data for the #WorldFoodDay
📊 Combining `ggbump` and a map to display a ranking, I chose to use IPC data instead and reproduce a chart by David Sjoberg.
#rstats #ipcinfo #ipc #fsl #dataviz #map #ggplot2
Code: guillaume-noblet.com/TidyTuesday/
📊 Combining `ggbump` and a map to display a ranking, I chose to use IPC data instead and reproduce a chart by David Sjoberg.
#rstats #ipcinfo #ipc #fsl #dataviz #map #ggplot2
Code: guillaume-noblet.com/TidyTuesday/
Reposted by Guillaume Noblet
#TidyTuesday a week late on Crane Observations at Lake Hornborgasjön, Sweden (1994–2024).
🗓️ Used a heatmap to look at the repeated yearly spring observations
🎷 `ggbranding` to add personal branding github.com/gnoblet/ggbr...
👽 Code: gnoblet.github.io/TidyTuesday/
#rstats #ggplot2 #heatmap #dataviz
🗓️ Used a heatmap to look at the repeated yearly spring observations
🎷 `ggbranding` to add personal branding github.com/gnoblet/ggbr...
👽 Code: gnoblet.github.io/TidyTuesday/
#rstats #ggplot2 #heatmap #dataviz

October 6, 2025 at 9:29 AM
#TidyTuesday a week late on Crane Observations at Lake Hornborgasjön, Sweden (1994–2024).
🗓️ Used a heatmap to look at the repeated yearly spring observations
🎷 `ggbranding` to add personal branding github.com/gnoblet/ggbr...
👽 Code: gnoblet.github.io/TidyTuesday/
#rstats #ggplot2 #heatmap #dataviz
🗓️ Used a heatmap to look at the repeated yearly spring observations
🎷 `ggbranding` to add personal branding github.com/gnoblet/ggbr...
👽 Code: gnoblet.github.io/TidyTuesday/
#rstats #ggplot2 #heatmap #dataviz
One of my graph has just entered the "best" section of the r-graph-gallery.com with a tutorial.
Featuring a waffle chart for time series, where the subtitle serves as a colorful legend.
Thanks a lot to @yan-holtz.bsky.social and @soeundataviz.bsky.social for adding it! #rstats #dataviz #ggplot2
Featuring a waffle chart for time series, where the subtitle serves as a colorful legend.
Thanks a lot to @yan-holtz.bsky.social and @soeundataviz.bsky.social for adding it! #rstats #dataviz #ggplot2

October 10, 2025 at 6:24 AM
One of my graph has just entered the "best" section of the r-graph-gallery.com with a tutorial.
Featuring a waffle chart for time series, where the subtitle serves as a colorful legend.
Thanks a lot to @yan-holtz.bsky.social and @soeundataviz.bsky.social for adding it! #rstats #dataviz #ggplot2
Featuring a waffle chart for time series, where the subtitle serves as a colorful legend.
Thanks a lot to @yan-holtz.bsky.social and @soeundataviz.bsky.social for adding it! #rstats #dataviz #ggplot2
#TidyTuesday Week 40 – I mostly just wanted to plot a map!
👉 Code: guillaume-noblet.com/TidyTuesday/
#DataScience #RStats #Geospatial #dataviz
👉 Code: guillaume-noblet.com/TidyTuesday/
#DataScience #RStats #Geospatial #dataviz

October 7, 2025 at 2:59 PM
#TidyTuesday Week 40 – I mostly just wanted to plot a map!
👉 Code: guillaume-noblet.com/TidyTuesday/
#DataScience #RStats #Geospatial #dataviz
👉 Code: guillaume-noblet.com/TidyTuesday/
#DataScience #RStats #Geospatial #dataviz
#TidyTuesday a week late on Crane Observations at Lake Hornborgasjön, Sweden (1994–2024).
🗓️ Used a heatmap to look at the repeated yearly spring observations
🎷 `ggbranding` to add personal branding github.com/gnoblet/ggbr...
👽 Code: gnoblet.github.io/TidyTuesday/
#rstats #ggplot2 #heatmap #dataviz
🗓️ Used a heatmap to look at the repeated yearly spring observations
🎷 `ggbranding` to add personal branding github.com/gnoblet/ggbr...
👽 Code: gnoblet.github.io/TidyTuesday/
#rstats #ggplot2 #heatmap #dataviz
October 6, 2025 at 9:29 AM
#TidyTuesday a week late on Crane Observations at Lake Hornborgasjön, Sweden (1994–2024).
🗓️ Used a heatmap to look at the repeated yearly spring observations
🎷 `ggbranding` to add personal branding github.com/gnoblet/ggbr...
👽 Code: gnoblet.github.io/TidyTuesday/
#rstats #ggplot2 #heatmap #dataviz
🗓️ Used a heatmap to look at the repeated yearly spring observations
🎷 `ggbranding` to add personal branding github.com/gnoblet/ggbr...
👽 Code: gnoblet.github.io/TidyTuesday/
#rstats #ggplot2 #heatmap #dataviz
Reposted by Guillaume Noblet

"Près de 50 m² de nature détruits chaque seconde : visualisez le bétonnage à grande échelle de l’Europe"
Hangars, usines géantes, villas… Pixel après pixel, l’analyse inédite d’images aériennes de notre enquête « Green to Grey »
@magalireghezza.bsky.social
www.lemonde.fr/les-decodeur...
Hangars, usines géantes, villas… Pixel après pixel, l’analyse inédite d’images aériennes de notre enquête « Green to Grey »
@magalireghezza.bsky.social
www.lemonde.fr/les-decodeur...

Près de 50 m² de nature détruits chaque seconde : visualisez le bétonnage à grande échelle de l’Europe
Hangars, usines géantes, villas… Pixel après pixel, l’analyse inédite d’images aériennes de notre enquête « Green to Grey » dévoile les causes et l’ampleur de l’artificialisation qui transforme le con...
www.lemonde.fr
October 1, 2025 at 1:18 PM
"Près de 50 m² de nature détruits chaque seconde : visualisez le bétonnage à grande échelle de l’Europe"
Hangars, usines géantes, villas… Pixel après pixel, l’analyse inédite d’images aériennes de notre enquête « Green to Grey »
@magalireghezza.bsky.social
www.lemonde.fr/les-decodeur...
Hangars, usines géantes, villas… Pixel après pixel, l’analyse inédite d’images aériennes de notre enquête « Green to Grey »
@magalireghezza.bsky.social
www.lemonde.fr/les-decodeur...
Reposted by Guillaume Noblet

Je préfère écouter les gens qui connaissent le dossier, c’est bien plus intéressant.
September 29, 2025 at 6:30 PM
Je préfère écouter les gens qui connaissent le dossier, c’est bien plus intéressant.
Two days on e/os from @murena-com.bsky.social and here is the amount of trackers blocked.
e/os installed on my #FP5 @fairphone.com
e/os installed on my #FP5 @fairphone.com

September 28, 2025 at 3:48 PM
Two days on e/os from @murena-com.bsky.social and here is the amount of trackers blocked.
e/os installed on my #FP5 @fairphone.com
e/os installed on my #FP5 @fairphone.com