


Jon Walls
@jonwalls.dev
Enthusiastic hacker. Startup veteran (Rill Data, Retool, Looker, Apptio). I like it when things "just work" but have been known to tweak bits and bytes to get things "just so".
Great article. What LLMs mean for education is a big question.
My personal analogy is that Christopher Nolan studied English: learning how to think about a script is as important as the skills a director needs to make a movie (if even someone/something else does the work). Same for CS vs coding.
My personal analogy is that Christopher Nolan studied English: learning how to think about a script is as important as the skills a director needs to make a movie (if even someone/something else does the work). Same for CS vs coding.
January 7, 2026 at 8:31 AM
Great article. What LLMs mean for education is a big question.
My personal analogy is that Christopher Nolan studied English: learning how to think about a script is as important as the skills a director needs to make a movie (if even someone/something else does the work). Same for CS vs coding.
My personal analogy is that Christopher Nolan studied English: learning how to think about a script is as important as the skills a director needs to make a movie (if even someone/something else does the work). Same for CS vs coding.
So true. Thinking first in terms of the tasks you want performed, before thinking about the agents you want to build, is a good order to go in.
January 6, 2026 at 2:44 AM
So true. Thinking first in terms of the tasks you want performed, before thinking about the agents you want to build, is a good order to go in.
I love the smell of burning tokens in the morning.
(This is the new motto of everyone leaning into agentic coding)
(This is the new motto of everyone leaning into agentic coding)
January 5, 2026 at 2:58 PM
I love the smell of burning tokens in the morning.
(This is the new motto of everyone leaning into agentic coding)
(This is the new motto of everyone leaning into agentic coding)
Nice first test run of Beads (github.com/steveyegge/b...) from @steve-yegge.bsky.social.
A new tool slotting smoothly into an existing project is nice. It really jibes with my way of thinking to have the coding agent use a real-but-lightweight issue tracker. Good summary from Claude on completion.
A new tool slotting smoothly into an existing project is nice. It really jibes with my way of thinking to have the coding agent use a real-but-lightweight issue tracker. Good summary from Claude on completion.

January 3, 2026 at 7:22 PM
Nice first test run of Beads (github.com/steveyegge/b...) from @steve-yegge.bsky.social.
A new tool slotting smoothly into an existing project is nice. It really jibes with my way of thinking to have the coding agent use a real-but-lightweight issue tracker. Good summary from Claude on completion.
A new tool slotting smoothly into an existing project is nice. It really jibes with my way of thinking to have the coding agent use a real-but-lightweight issue tracker. Good summary from Claude on completion.
I do love a good data vis labour of love

#rstats ANNOUNCE:
The {ggCheysson} 📦 brings the graphical styles of the Albums de Statistique Graphique to R and ggplot2.
Not yet on CRAN, and still under development.
friendly.github.io/ggCheysson/
The {ggCheysson} 📦 brings the graphical styles of the Albums de Statistique Graphique to R and ggplot2.
Not yet on CRAN, and still under development.
friendly.github.io/ggCheysson/

Graphic Styles of Emile Cheysson for ggplot2
Implements for ggplot2 the stylistic elements (fonts, hatched patterns, color palettes) used by Emile Cheysson in the Albums de Statistique Graphique, sometimes called the pinnacle of the Golden Age o...
friendly.github.io
January 2, 2026 at 8:36 PM
I do love a good data vis labour of love
Designing Data-Intensive Applications was an instant classic - nice to know 2nd ed. is coming!
January 1, 2026 at 3:41 PM
Designing Data-Intensive Applications was an instant classic - nice to know 2nd ed. is coming!
Reposted by Jon Walls

“Sometimes the best reward isn't money. It's watching the giants scramble to copy your stupid SQL feature." - Hannes Mühleisen, DuckDB
In the updated episode, we discussed:
→ Why they worked in secret for a year
→ Why 99% of analytics workloads don't need distributed systems
datatalks.rilldata.com
In the updated episode, we discussed:
→ Why they worked in secret for a year
→ Why 99% of analytics workloads don't need distributed systems
datatalks.rilldata.com
December 19, 2025 at 2:27 PM
“Sometimes the best reward isn't money. It's watching the giants scramble to copy your stupid SQL feature." - Hannes Mühleisen, DuckDB
In the updated episode, we discussed:
→ Why they worked in secret for a year
→ Why 99% of analytics workloads don't need distributed systems
datatalks.rilldata.com
In the updated episode, we discussed:
→ Why they worked in secret for a year
→ Why 99% of analytics workloads don't need distributed systems
datatalks.rilldata.com
Liked this post by Ahmad El-Alfy (via HNews thread) on URLs as state containers. Often neglected in app design but compelling to end users.
Not so easy to get right since not all state should be in URL, and weirdness can happen with permissions. Always worth it though.
alfy.blog/2025/10/31/y...
Not so easy to get right since not all state should be in URL, and weirdness can happen with permissions. Always worth it though.
alfy.blog/2025/10/31/y...
Your URL Is Your State
A deep dive into how thoughtful URL design can enhance usability, shareability, and performance. Learn what state belongs in URLs, common pitfalls to avoid, and practical patterns for modern web apps.
alfy.blog
November 3, 2025 at 10:31 AM
Liked this post by Ahmad El-Alfy (via HNews thread) on URLs as state containers. Often neglected in app design but compelling to end users.
Not so easy to get right since not all state should be in URL, and weirdness can happen with permissions. Always worth it though.
alfy.blog/2025/10/31/y...
Not so easy to get right since not all state should be in URL, and weirdness can happen with permissions. Always worth it though.
alfy.blog/2025/10/31/y...
Reposted by Jon Walls

All I saw was cheesecake boat and ocean for at least 5 minutes

September 12, 2025 at 5:08 PM
All I saw was cheesecake boat and ocean for at least 5 minutes
Reposted by Jon Walls
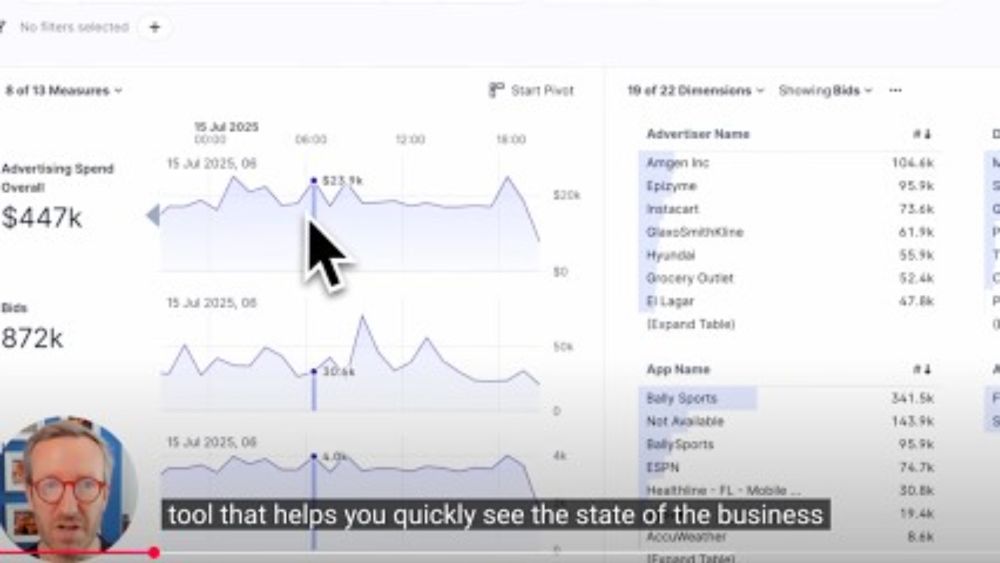
Welcome to our 💡Tip Thursday💡 series where @jonwalls.dev highlights ways to slice & dice your data.
The goal of each Rill dashboard is to provide users with metrics & dimensions for various use cases and to create an interactive experience to cut data in any form.
www.youtube.com/playlist?lis...
The goal of each Rill dashboard is to provide users with metrics & dimensions for various use cases and to create an interactive experience to cut data in any form.
www.youtube.com/playlist?lis...
Exploring Data with Rill - YouTube
Series of short tutorials showing you how to slice'n'dice your data in Rill
www.youtube.com
July 17, 2025 at 3:59 PM
Welcome to our 💡Tip Thursday💡 series where @jonwalls.dev highlights ways to slice & dice your data.
The goal of each Rill dashboard is to provide users with metrics & dimensions for various use cases and to create an interactive experience to cut data in any form.
www.youtube.com/playlist?lis...
The goal of each Rill dashboard is to provide users with metrics & dimensions for various use cases and to create an interactive experience to cut data in any form.
www.youtube.com/playlist?lis...
Enjoying messing around with Claude Code! It does say "you're absolutely right" a lot, though. Pretty sure I'd have been done with my little weekend project by now if I was "absolutely right" with every idea and prompt...
June 8, 2025 at 3:48 PM
Enjoying messing around with Claude Code! It does say "you're absolutely right" a lot, though. Pretty sure I'd have been done with my little weekend project by now if I was "absolutely right" with every idea and prompt...
My (limited!) experience is
- Forgive yourself your first recordings. You’ll get better, but first you must ship.
- You do get used to yourself. Enough so you’re focused on what you’re trying to achieve.
- The only criticism that really hurts is of your ideas. Same risk as writing them down!
- Forgive yourself your first recordings. You’ll get better, but first you must ship.
- You do get used to yourself. Enough so you’re focused on what you’re trying to achieve.
- The only criticism that really hurts is of your ideas. Same risk as writing them down!
June 2, 2025 at 8:22 AM
My (limited!) experience is
- Forgive yourself your first recordings. You’ll get better, but first you must ship.
- You do get used to yourself. Enough so you’re focused on what you’re trying to achieve.
- The only criticism that really hurts is of your ideas. Same risk as writing them down!
- Forgive yourself your first recordings. You’ll get better, but first you must ship.
- You do get used to yourself. Enough so you’re focused on what you’re trying to achieve.
- The only criticism that really hurts is of your ideas. Same risk as writing them down!
The performance and editing are skills for sure.
“Artifice” implies dishonesty but it’s like learning an instrument: authentic performance takes lots of practice.
Without practice, the audience pays more attention to the quality of the performance than anything you actually say.
“Artifice” implies dishonesty but it’s like learning an instrument: authentic performance takes lots of practice.
Without practice, the audience pays more attention to the quality of the performance than anything you actually say.
June 2, 2025 at 8:11 AM
The performance and editing are skills for sure.
“Artifice” implies dishonesty but it’s like learning an instrument: authentic performance takes lots of practice.
Without practice, the audience pays more attention to the quality of the performance than anything you actually say.
“Artifice” implies dishonesty but it’s like learning an instrument: authentic performance takes lots of practice.
Without practice, the audience pays more attention to the quality of the performance than anything you actually say.
"You're absolutely right on all counts."
Oh LLM sycophants, I may talk like it (it's a professional hazard in tech), but it really isn't true.
Oh LLM sycophants, I may talk like it (it's a professional hazard in tech), but it really isn't true.
May 31, 2025 at 11:36 AM
"You're absolutely right on all counts."
Oh LLM sycophants, I may talk like it (it's a professional hazard in tech), but it really isn't true.
Oh LLM sycophants, I may talk like it (it's a professional hazard in tech), but it really isn't true.
A bit inspired by @simonwillison.net 's stream of vibe-coded "low stakes" tools, was pleased with Claude's take on explaining composition effects. The ratio of a subset of unique counts to the total unique count falls the longer the time window. Which still boggles my mind. How can 7 x 29 = 6?!


May 29, 2025 at 9:57 AM
A bit inspired by @simonwillison.net 's stream of vibe-coded "low stakes" tools, was pleased with Claude's take on explaining composition effects. The ratio of a subset of unique counts to the total unique count falls the longer the time window. Which still boggles my mind. How can 7 x 29 = 6?!
Good policy. LLMs are useful, but have also provided plenty of examples of how knowing when to say “no” is important!
April 30, 2025 at 2:47 PM
Good policy. LLMs are useful, but have also provided plenty of examples of how knowing when to say “no” is important!
Reposted by Jon Walls

@dazzle.fm's internal topic heatmap for Bluesky is now available to the public
dazzle.fm/stats
Seeing surges of discussion around a topic and working backwards to figure out what caused the spike is a fun past time
The 1am science spike is still a mystery though
dazzle.fm/stats
Seeing surges of discussion around a topic and working backwards to figure out what caused the spike is a fun past time
The 1am science spike is still a mystery though

April 7, 2025 at 3:35 PM
@dazzle.fm's internal topic heatmap for Bluesky is now available to the public
dazzle.fm/stats
Seeing surges of discussion around a topic and working backwards to figure out what caused the spike is a fun past time
The 1am science spike is still a mystery though
dazzle.fm/stats
Seeing surges of discussion around a topic and working backwards to figure out what caused the spike is a fun past time
The 1am science spike is still a mystery though
That's one helluva landing page!

After 5 years in the making, I'm very happy to finally release Anime.js v4, my dream animation library:
🧩 New modular API
⚡️ Highly performant
🖱️ Scroll-linked animations
🫵 Draggables
↔️ Responsive
✨ Additive animations
🪽 WAAPI support
And so much more!
Check out the new website animejs.com!
🧩 New modular API
⚡️ Highly performant
🖱️ Scroll-linked animations
🫵 Draggables
↔️ Responsive
✨ Additive animations
🪽 WAAPI support
And so much more!
Check out the new website animejs.com!
April 3, 2025 at 8:47 PM
That's one helluva landing page!
Sixteenth century version of having too many tabs open


March 9, 2025 at 7:37 AM
Sixteenth century version of having too many tabs open
Reposted by Jon Walls

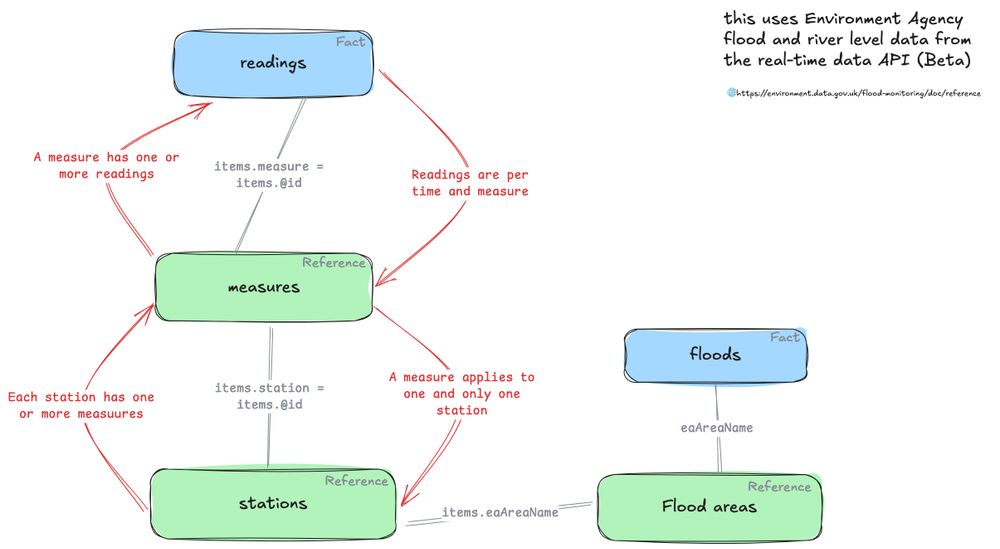
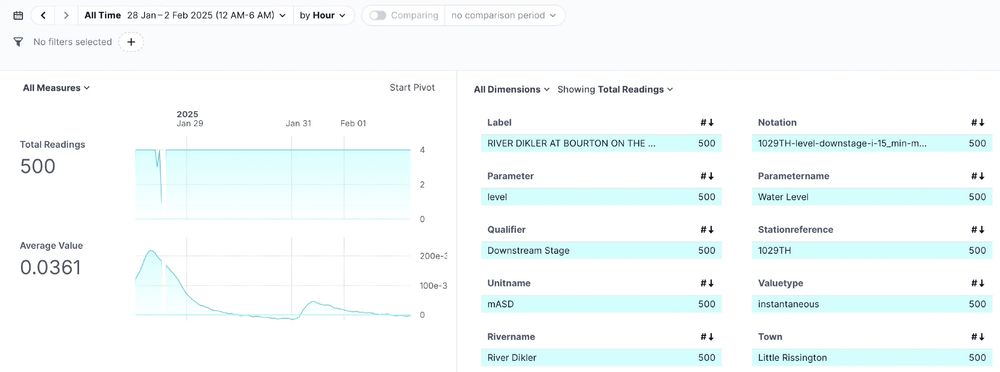
Blogged: Exploring UK Environment Agency data with @duckdb.org and @rilldata.com
rmoff.net/2025/02/28/e...
#dataBS
rmoff.net/2025/02/28/e...
#dataBS

February 28, 2025 at 11:38 AM
Blogged: Exploring UK Environment Agency data with @duckdb.org and @rilldata.com
rmoff.net/2025/02/28/e...
#dataBS
rmoff.net/2025/02/28/e...
#dataBS
Reposted by Jon Walls

Manager: "What's this milestone 'Living on a prayer' ?"
Me: "That's the documentation deliverable."
Manager: "What's the status of that?"
Me: "We're halfway there"
Manager: "Why is progress so slow?"
Me: "You fired Tommy"
Manager: "So?"
Me: "Tommy used to work on the docs"
Me: "That's the documentation deliverable."
Manager: "What's the status of that?"
Me: "We're halfway there"
Manager: "Why is progress so slow?"
Me: "You fired Tommy"
Manager: "So?"
Me: "Tommy used to work on the docs"
February 23, 2025 at 9:12 PM
Manager: "What's this milestone 'Living on a prayer' ?"
Me: "That's the documentation deliverable."
Manager: "What's the status of that?"
Me: "We're halfway there"
Manager: "Why is progress so slow?"
Me: "You fired Tommy"
Manager: "So?"
Me: "Tommy used to work on the docs"
Me: "That's the documentation deliverable."
Manager: "What's the status of that?"
Me: "We're halfway there"
Manager: "Why is progress so slow?"
Me: "You fired Tommy"
Manager: "So?"
Me: "Tommy used to work on the docs"
Work has had me in JS world for years and recently Go. I’ll still fire up the occasional Python notebook to try out a technique or perform a quick task.
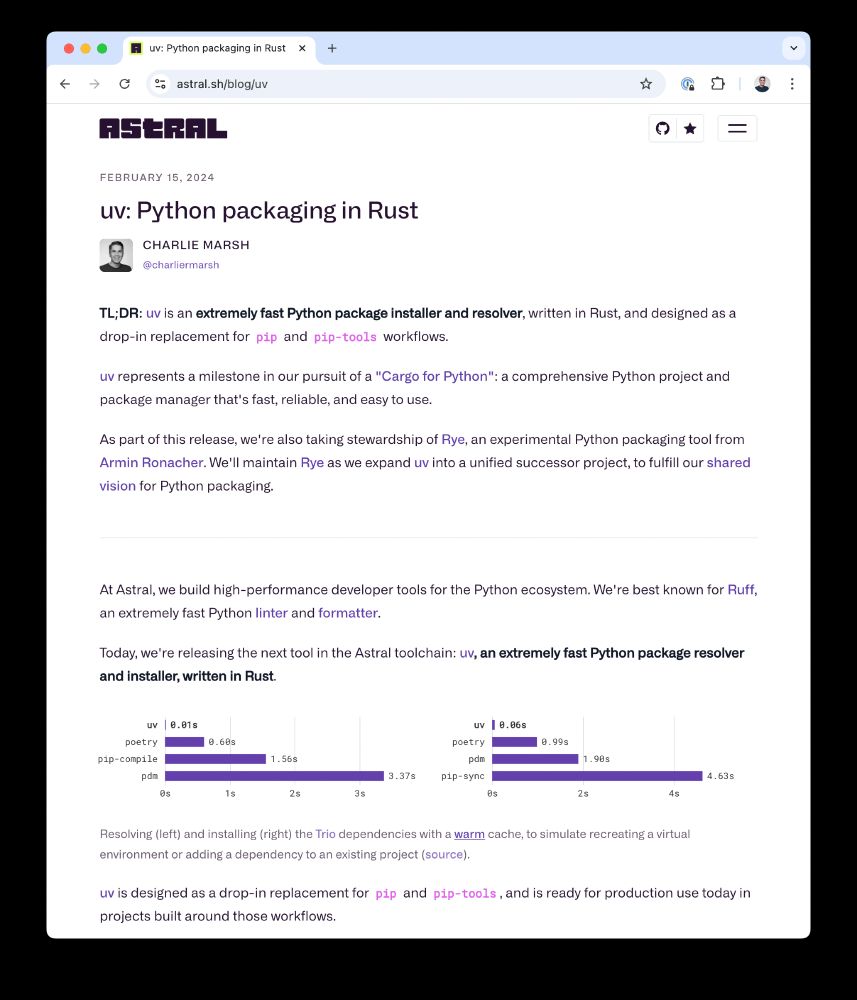
Tried uv recently when I got a new machine, and was gearing up to review my Python setup.
It’s sooooo much better. Good infra. Recommended.
Tried uv recently when I got a new machine, and was gearing up to review my Python setup.
It’s sooooo much better. Good infra. Recommended.

uv is one year old today. Hard to believe its only been a year. The growth, adoption, and impact surpassed my wildest expectations.
Happy birthday, uv! 🥳
Happy birthday, uv! 🥳
February 16, 2025 at 8:16 AM
Work has had me in JS world for years and recently Go. I’ll still fire up the occasional Python notebook to try out a technique or perform a quick task.
Tried uv recently when I got a new machine, and was gearing up to review my Python setup.
It’s sooooo much better. Good infra. Recommended.
Tried uv recently when I got a new machine, and was gearing up to review my Python setup.
It’s sooooo much better. Good infra. Recommended.
Scenarios where including a viz guru is better/faster: cheaper:
- data needs wrangling
- viz work is 10x faster with data tools
- most data does not “speak” w/o normalisation, or variance, or cohorting, or …
- viz gurus make *interactive* tools
- can export viz to vector formats for design collab.
- data needs wrangling
- viz work is 10x faster with data tools
- most data does not “speak” w/o normalisation, or variance, or cohorting, or …
- viz gurus make *interactive* tools
- can export viz to vector formats for design collab.
February 14, 2025 at 12:52 PM
Scenarios where including a viz guru is better/faster: cheaper:
- data needs wrangling
- viz work is 10x faster with data tools
- most data does not “speak” w/o normalisation, or variance, or cohorting, or …
- viz gurus make *interactive* tools
- can export viz to vector formats for design collab.
- data needs wrangling
- viz work is 10x faster with data tools
- most data does not “speak” w/o normalisation, or variance, or cohorting, or …
- viz gurus make *interactive* tools
- can export viz to vector formats for design collab.
I’m in the camp that data vis is a great skill, have spent lots of time with d3.
But can’t think of any full time, long term, inhouse data viz specialists. Except maybe outsourced labour churning out dashboards.
Isn’t good viz work better paid as design, analysis, engineering, strategy, etc?
But can’t think of any full time, long term, inhouse data viz specialists. Except maybe outsourced labour churning out dashboards.
Isn’t good viz work better paid as design, analysis, engineering, strategy, etc?
February 14, 2025 at 11:56 AM
I’m in the camp that data vis is a great skill, have spent lots of time with d3.
But can’t think of any full time, long term, inhouse data viz specialists. Except maybe outsourced labour churning out dashboards.
Isn’t good viz work better paid as design, analysis, engineering, strategy, etc?
But can’t think of any full time, long term, inhouse data viz specialists. Except maybe outsourced labour churning out dashboards.
Isn’t good viz work better paid as design, analysis, engineering, strategy, etc?