


Matthias Sprenger
@matthiasprenger.bsky.social
Hydrologist working on catchment hydrology, ecohydrology, stable isotopes, and Critical Zone research, https://matthiassprenger.weebly.com/
Reposted by Matthias Sprenger
Our ability to figure out how old stream water is relies almost entirely on environmental tracers. But stable water isotopes rarely tell us anything about water parcels older than 1–2 years, and even tritium often doesn’t push that limit much further dx.doi.org/10.1029/2025....

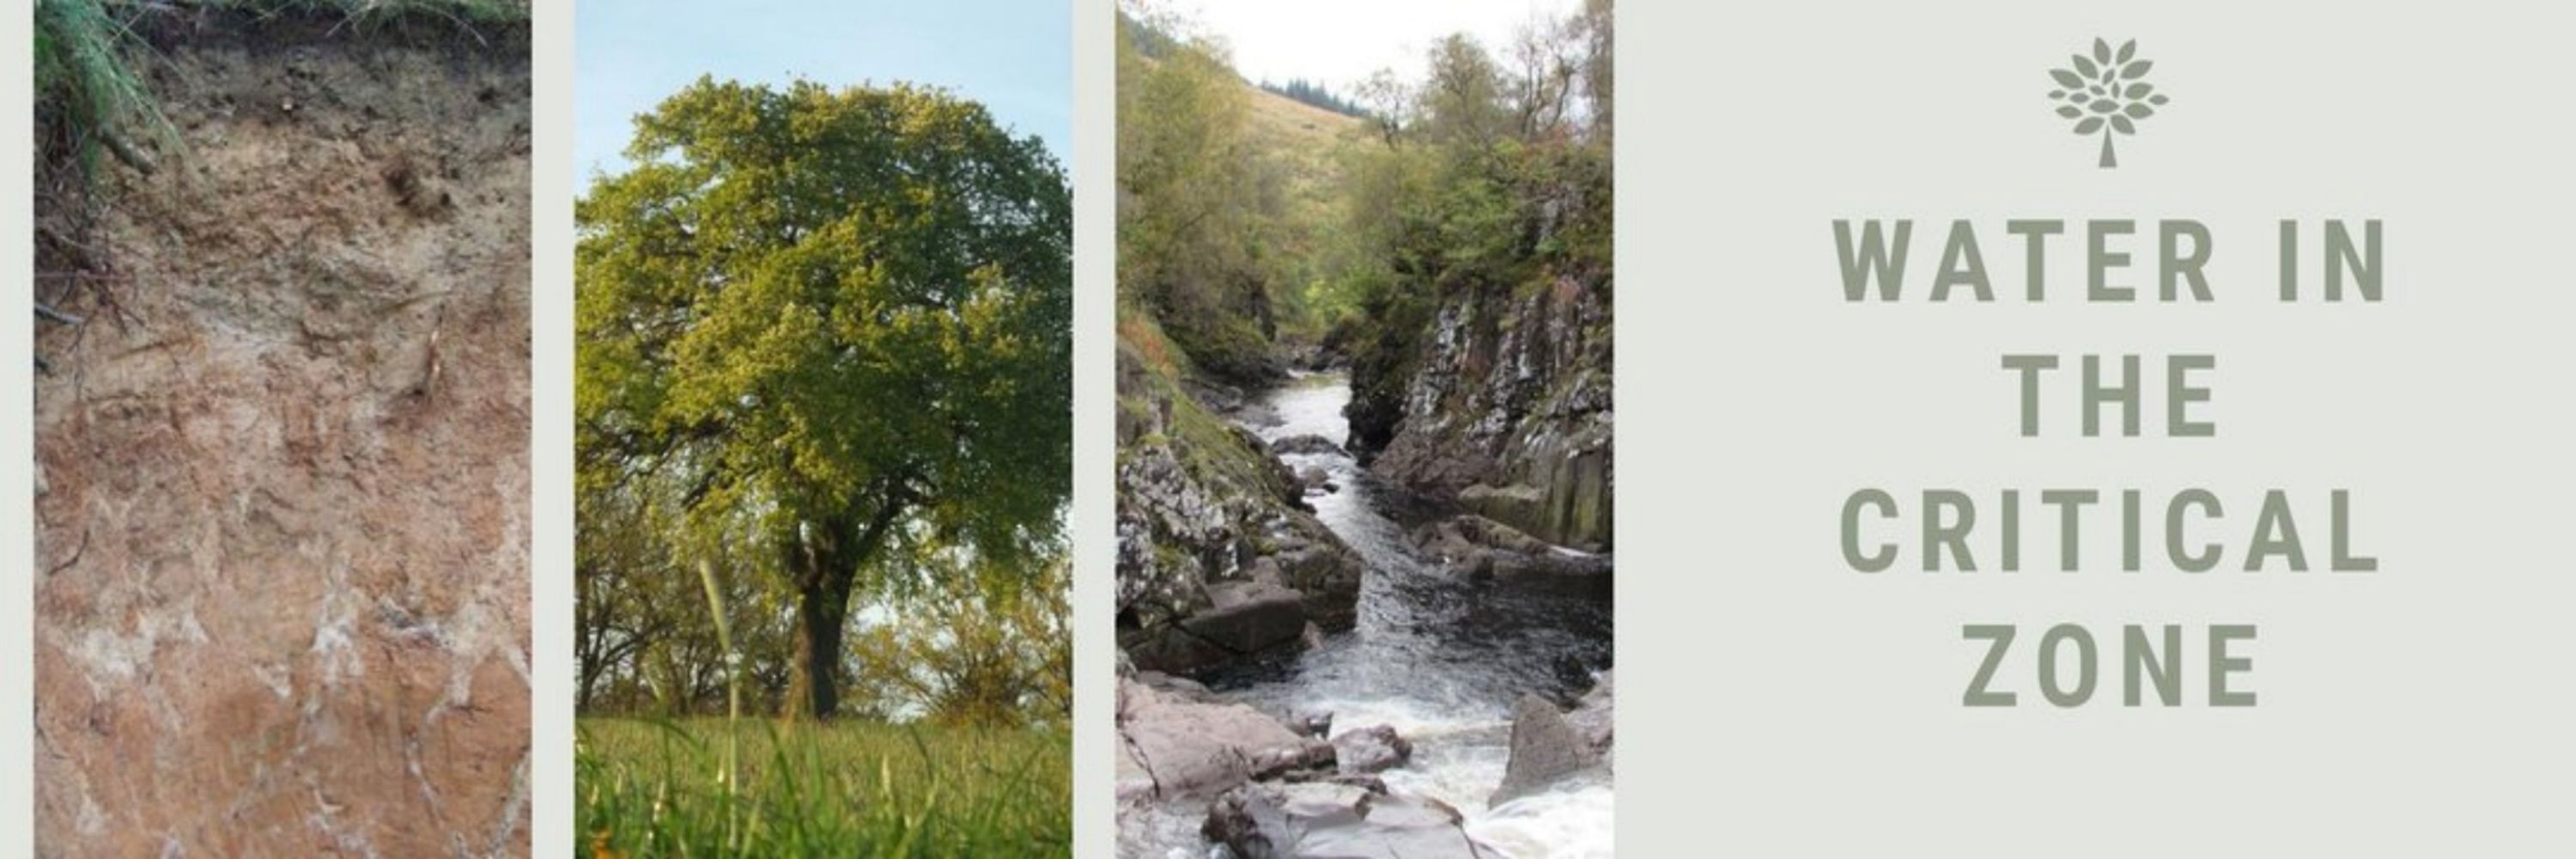
Limits to the Estimation of Old Streamwater in Catchments Using Environmental Tracers
Estimating the age of older stream waters is limited by weak tracer signals and uncertainty We propose a general framework to identify the maximum water age that can be reliably determined using ...
dx.doi.org
November 24, 2025 at 3:03 PM
Our ability to figure out how old stream water is relies almost entirely on environmental tracers. But stable water isotopes rarely tell us anything about water parcels older than 1–2 years, and even tritium often doesn’t push that limit much further dx.doi.org/10.1029/2025....
Reposted by Matthias Sprenger
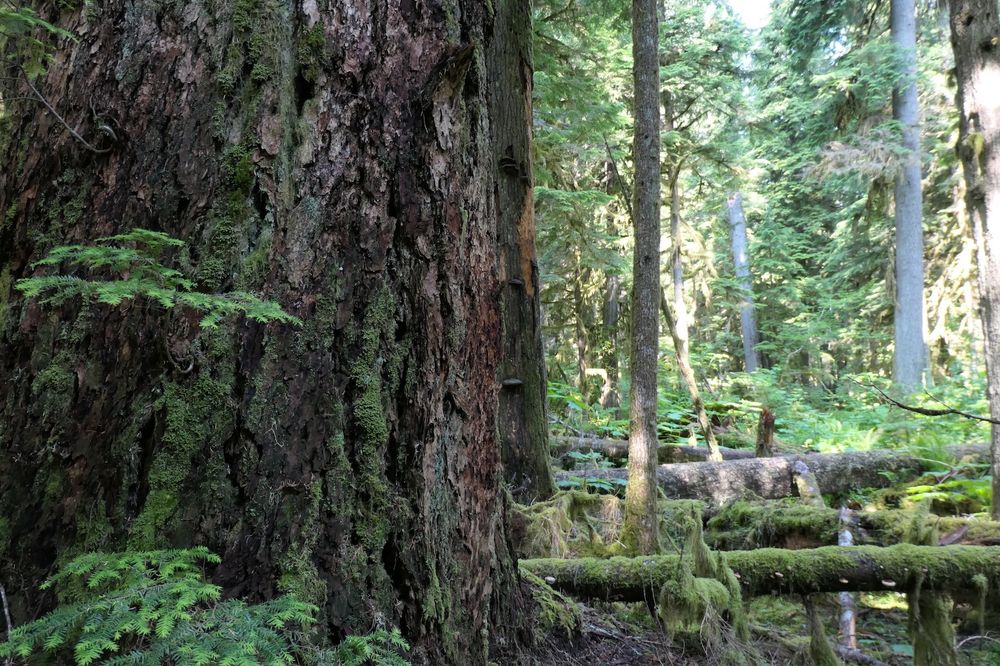
Our department at UBC is hiring for a professor of forest ecophysiology, including "tree ecophysiology; plant abiotic or biotic stress physiology; forest mortality and climate change responses; forest carbon balance; tree water relations; or nutrient use." Learn more at: tinyurl.com/5da56f5c

October 6, 2025 at 10:12 PM
Our department at UBC is hiring for a professor of forest ecophysiology, including "tree ecophysiology; plant abiotic or biotic stress physiology; forest mortality and climate change responses; forest carbon balance; tree water relations; or nutrient use." Learn more at: tinyurl.com/5da56f5c
Reposted by Matthias Sprenger
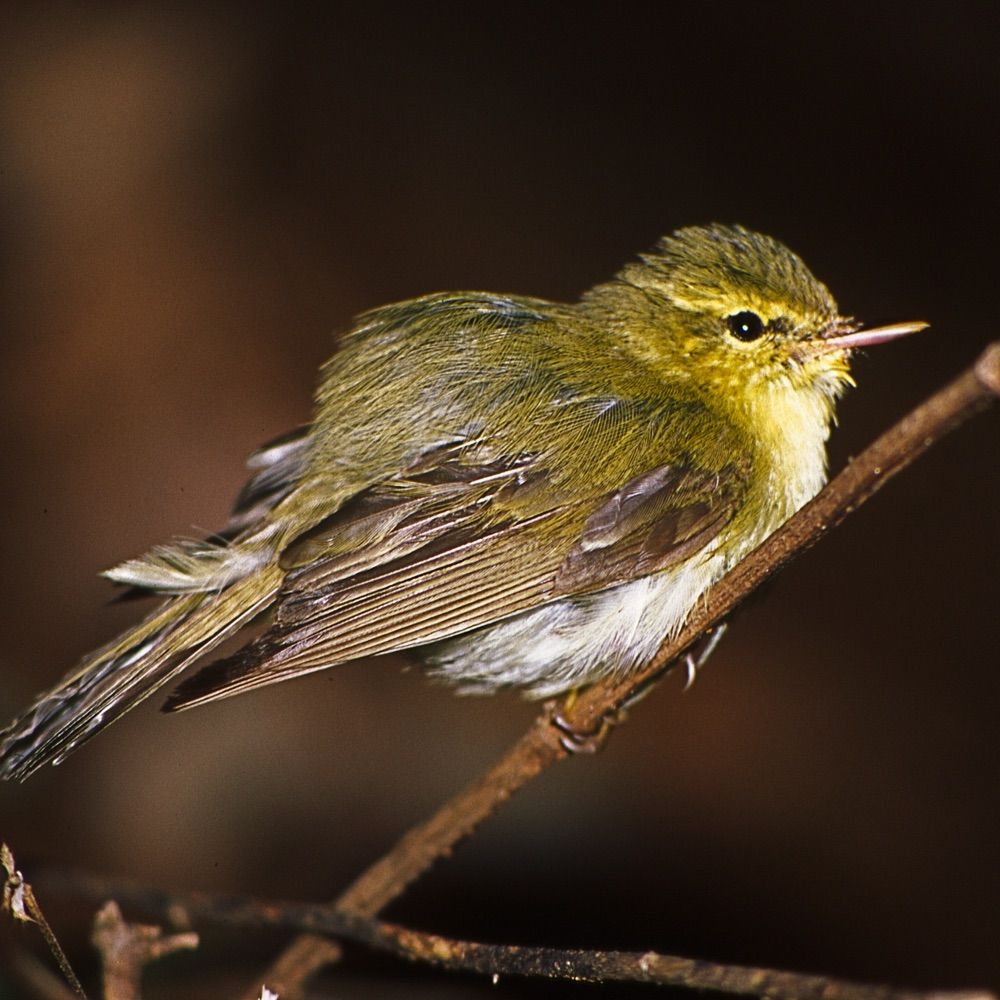
Join the Laboratory of Tree-Ring Research at the University of Arizona for our 2026 Dendrochronology Intensive Summer Course (DISC)! Spend 3 great weeks (May 18th to June 5, 2026) in the field, lab, and classroom learning first-hand how tree-ring research is done! ltrr.arizona.edu/summerschool
Dendrochronology Intensive Summer Course (DISC) 2026 | Laboratory of Tree-Ring Research
ltrr.arizona.edu
November 24, 2025 at 10:01 PM
Join the Laboratory of Tree-Ring Research at the University of Arizona for our 2026 Dendrochronology Intensive Summer Course (DISC)! Spend 3 great weeks (May 18th to June 5, 2026) in the field, lab, and classroom learning first-hand how tree-ring research is done! ltrr.arizona.edu/summerschool
Reposted by Matthias Sprenger
Time to get your public comments in on the proposed Waters of the U.S. rule that would strip protections for countless wetlands and streams.
Trout unlimited has a tool on their page that will automatically send your message to the EPA as well as your representatives:
www.tu.org/conservation...
Trout unlimited has a tool on their page that will automatically send your message to the EPA as well as your representatives:
www.tu.org/conservation...
November 23, 2025 at 11:03 PM
Time to get your public comments in on the proposed Waters of the U.S. rule that would strip protections for countless wetlands and streams.
Trout unlimited has a tool on their page that will automatically send your message to the EPA as well as your representatives:
www.tu.org/conservation...
Trout unlimited has a tool on their page that will automatically send your message to the EPA as well as your representatives:
www.tu.org/conservation...
Reposted by Matthias Sprenger
Would you like to study #functional trait diversity and biogeochemical dynamics in rapidly changing #tundra ecosystems? Then this #PhD is for you! 👇 You will do fieldwork in #Alaska, #Svalbard and #Italy and work with amazing Matteo Petit Bon. Apply by Dec 19
herbivory.lbhi.is/2025/11/19/p...
herbivory.lbhi.is/2025/11/19/p...

November 23, 2025 at 10:12 AM
Would you like to study #functional trait diversity and biogeochemical dynamics in rapidly changing #tundra ecosystems? Then this #PhD is for you! 👇 You will do fieldwork in #Alaska, #Svalbard and #Italy and work with amazing Matteo Petit Bon. Apply by Dec 19
herbivory.lbhi.is/2025/11/19/p...
herbivory.lbhi.is/2025/11/19/p...
Reposted by Matthias Sprenger

Ojo Obrero
Ojo Obrero: Immigration advocacy and community engagement platform
ojonc.org
November 19, 2025 at 1:23 PM
Reposted by Matthias Sprenger

My colleague @avnimalh0tra.bsky.social is hiring a Postdoctoral Research Associate to investigate rhizosphere processes influencing methane (CH₄) dynamics in northern peatlands! Super cool opening -- please circulate careers.pnnl.gov/jobs/11061?l...

Post Doctorate Research Associate - Peatland Rhizosphere and Trace Gas Processes in Richland, Washington | Pacific Northwest National Laboratory
PNNL is hiring a Post Doctorate Research Associate - Peatland Rhizosphere and Trace Gas Processes in Richland, Washington. Review all of the job details and apply today!
careers.pnnl.gov
November 17, 2025 at 6:58 PM
My colleague @avnimalh0tra.bsky.social is hiring a Postdoctoral Research Associate to investigate rhizosphere processes influencing methane (CH₄) dynamics in northern peatlands! Super cool opening -- please circulate careers.pnnl.gov/jobs/11061?l...
Reposted by Matthias Sprenger
Work with #StableIsotopes in aquatic systems?
Submit your abstract to:
Session SS077
Stable Isotope Solutions to Aquatic Ecology Problems
ASLO‑SIL 2026 | Montreal | 12–16 May
Deadline: Nov 25
🔗 aslo.secure-platform.com/2026
#ASLOSIL26 #IsotopeEcology #AquaticEcology #Ecology #FoodWebs
Submit your abstract to:
Session SS077
Stable Isotope Solutions to Aquatic Ecology Problems
ASLO‑SIL 2026 | Montreal | 12–16 May
Deadline: Nov 25
🔗 aslo.secure-platform.com/2026
#ASLOSIL26 #IsotopeEcology #AquaticEcology #Ecology #FoodWebs

November 17, 2025 at 9:40 AM
Work with #StableIsotopes in aquatic systems?
Submit your abstract to:
Session SS077
Stable Isotope Solutions to Aquatic Ecology Problems
ASLO‑SIL 2026 | Montreal | 12–16 May
Deadline: Nov 25
🔗 aslo.secure-platform.com/2026
#ASLOSIL26 #IsotopeEcology #AquaticEcology #Ecology #FoodWebs
Submit your abstract to:
Session SS077
Stable Isotope Solutions to Aquatic Ecology Problems
ASLO‑SIL 2026 | Montreal | 12–16 May
Deadline: Nov 25
🔗 aslo.secure-platform.com/2026
#ASLOSIL26 #IsotopeEcology #AquaticEcology #Ecology #FoodWebs
Reposted by Matthias Sprenger
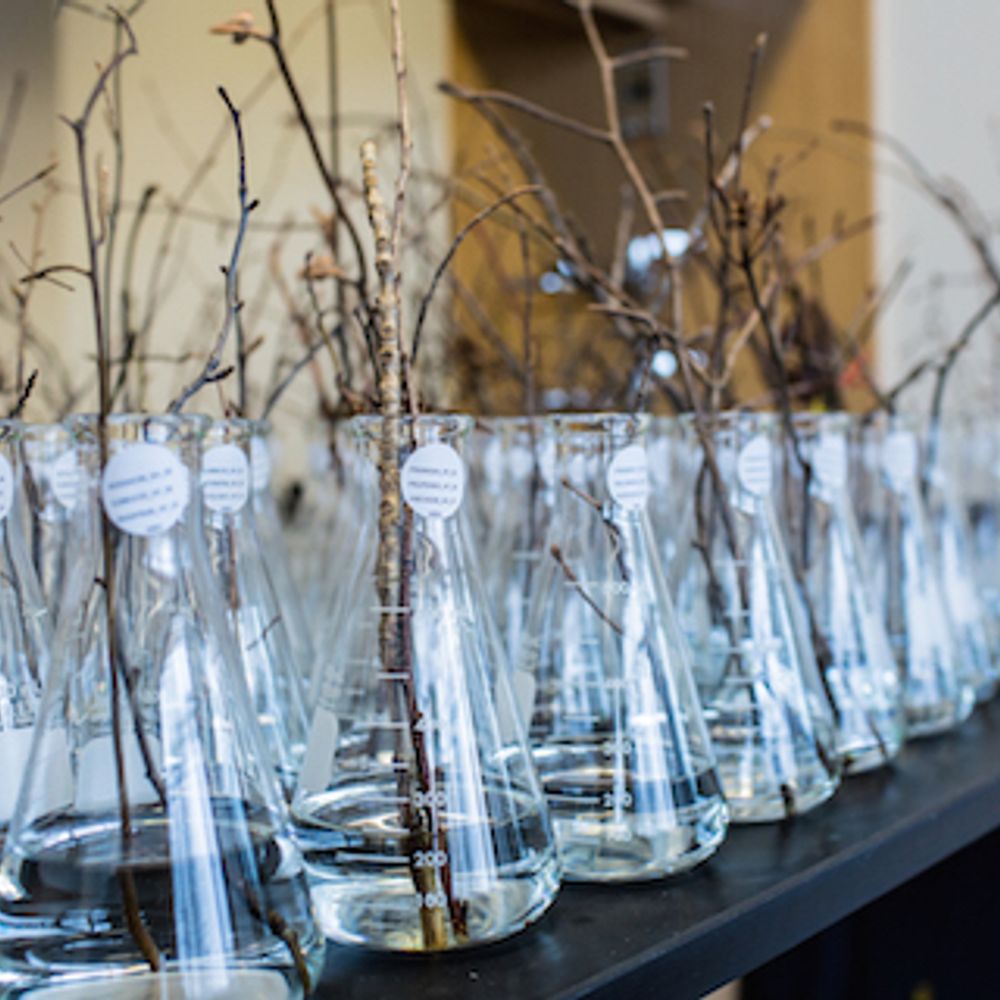
Another great effort and teamwork from the past #WATSON #COST #Action www.watson-cost.eu to show a pan-European #database of #isotope #data in #soil #water and #xylem in #beech and #spruce #trees.
essd.copernicus.org/articles/17/...
And thank you @lehmannmm.bsky.social for the efficient leadership!
essd.copernicus.org/articles/17/...
And thank you @lehmannmm.bsky.social for the efficient leadership!

November 14, 2025 at 10:44 PM
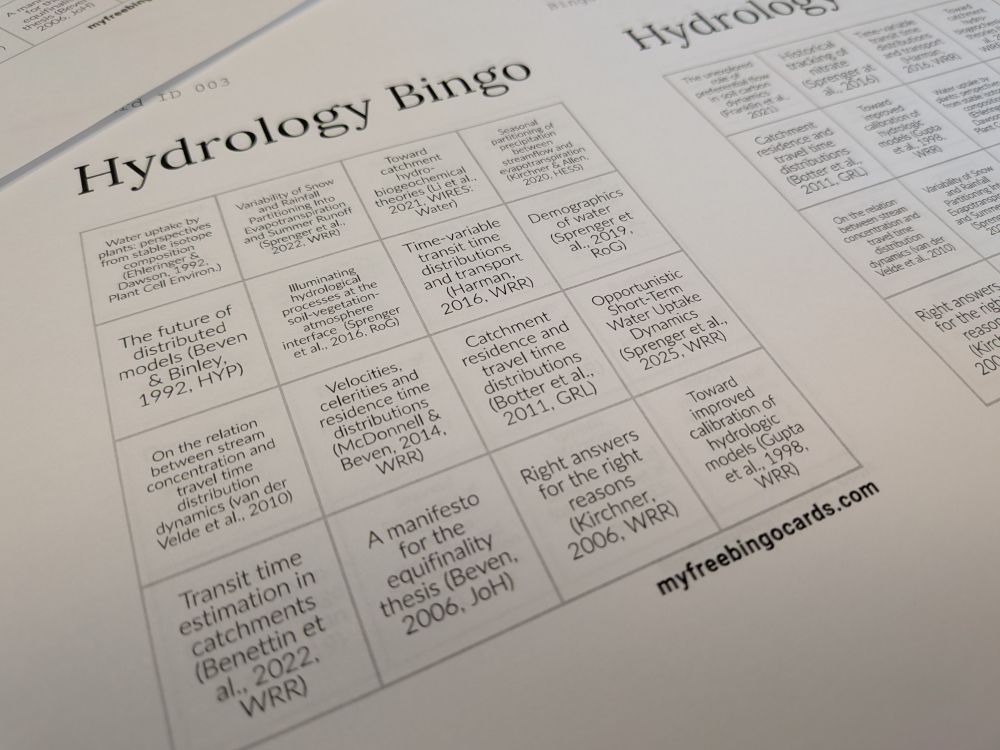
I'm giving a chalk talk on Monday to Freshwater scientists in the Triangle Area that regularly come together in "Converge Meetings", initiated by @agdelv.bsky.social. I think of adding a Hydrology Bingo to go with concepts I'll be mentioning along the way. Distracting and silly? Or engaging and fun?
November 14, 2025 at 4:12 PM
I'm giving a chalk talk on Monday to Freshwater scientists in the Triangle Area that regularly come together in "Converge Meetings", initiated by @agdelv.bsky.social. I think of adding a Hydrology Bingo to go with concepts I'll be mentioning along the way. Distracting and silly? Or engaging and fun?
Reposted by Matthias Sprenger

🚨Job opportunity🚨
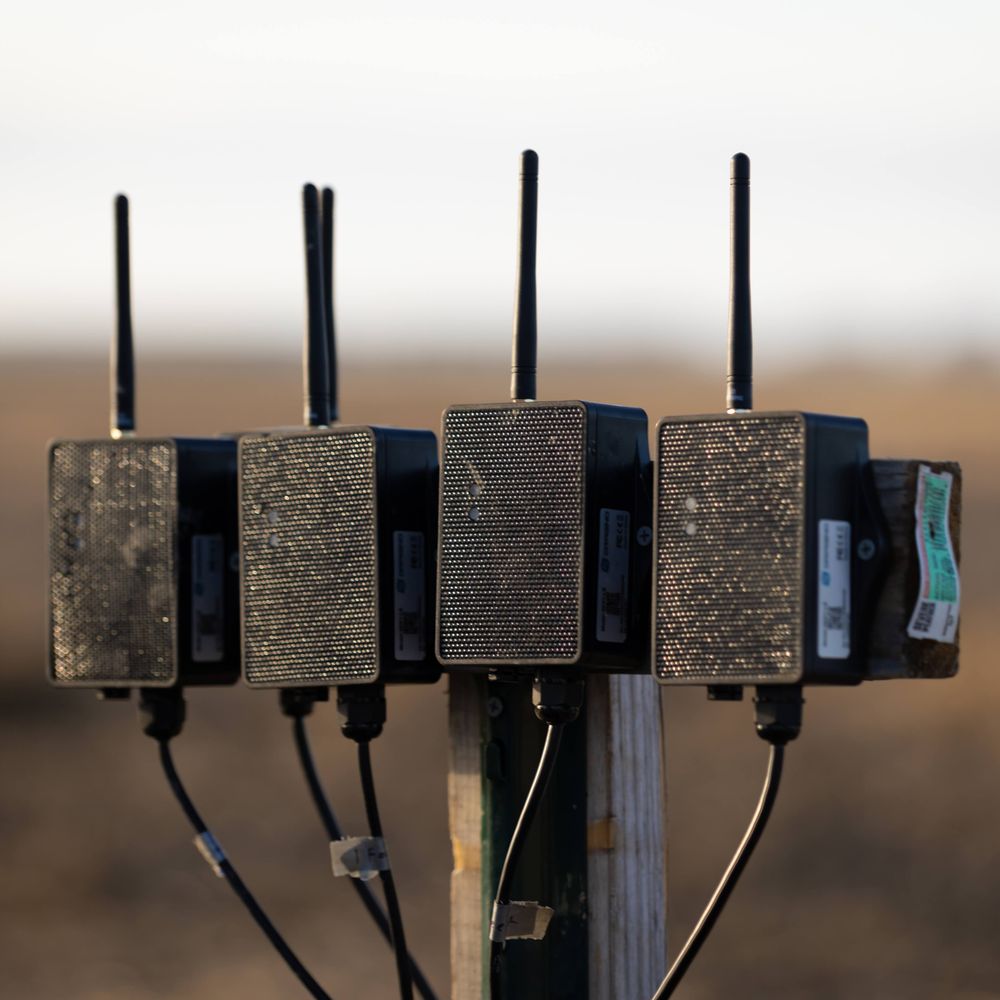
We are hiring a 3yr research technician. If you love fieldwork, are passionate about forests & mountains, and want to up-skill in remote sensing, sensor networks and running field experiments this could be the dream job for you!
🧪🌳⛰️🛰️🌡️🍄
www.bristol.ac.uk/jobs/find/de...
We are hiring a 3yr research technician. If you love fieldwork, are passionate about forests & mountains, and want to up-skill in remote sensing, sensor networks and running field experiments this could be the dream job for you!
🧪🌳⛰️🛰️🌡️🍄
www.bristol.ac.uk/jobs/find/de...
Details | Working at Bristol | University of Bristol
www.bristol.ac.uk
November 14, 2025 at 9:38 AM
🚨Job opportunity🚨
We are hiring a 3yr research technician. If you love fieldwork, are passionate about forests & mountains, and want to up-skill in remote sensing, sensor networks and running field experiments this could be the dream job for you!
🧪🌳⛰️🛰️🌡️🍄
www.bristol.ac.uk/jobs/find/de...
We are hiring a 3yr research technician. If you love fieldwork, are passionate about forests & mountains, and want to up-skill in remote sensing, sensor networks and running field experiments this could be the dream job for you!
🧪🌳⛰️🛰️🌡️🍄
www.bristol.ac.uk/jobs/find/de...
Reposted by Matthias Sprenger
I've been on the road so I'm behind the times—but if you wanted to destroy US science, I can think of no more expedient action.
Blatant unconstitutionality aside, fuck this backwards forwards and sideways.
www.science.org/content/article/u-s-congress-considers-sweeping-ban-chinese-collaborations
Blatant unconstitutionality aside, fuck this backwards forwards and sideways.
www.science.org/content/article/u-s-congress-considers-sweeping-ban-chinese-collaborations

November 14, 2025 at 3:03 AM
I've been on the road so I'm behind the times—but if you wanted to destroy US science, I can think of no more expedient action.
Blatant unconstitutionality aside, fuck this backwards forwards and sideways.
www.science.org/content/article/u-s-congress-considers-sweeping-ban-chinese-collaborations
Blatant unconstitutionality aside, fuck this backwards forwards and sideways.
www.science.org/content/article/u-s-congress-considers-sweeping-ban-chinese-collaborations
Today, 10 years ago I defended my PhD thesis at the Uni. of Freiburg! Look at this great doctoral hat my colleagues created that showed my field work activities back then. Markus Weiler as supervisor, 2nd supervisor @kjmcguire.bsky.social connected via video, & Christine Stumpp as external expert.


November 14, 2025 at 12:32 AM
Today, 10 years ago I defended my PhD thesis at the Uni. of Freiburg! Look at this great doctoral hat my colleagues created that showed my field work activities back then. Markus Weiler as supervisor, 2nd supervisor @kjmcguire.bsky.social connected via video, & Christine Stumpp as external expert.
Reposted by Matthias Sprenger
Last #WARR in 2025!!
Drs. Theresa Blume (GFZ, Germany) + Holly Barnard (CU Boulder, US) on
Waters above + below ground:
How root uptake, transpiration, + subsurface stormflow connect drought, floods, ecosystems?
Register: psu.zoom.us/meeting/regi...
@waterbarnes.bsky.social
Drs. Theresa Blume (GFZ, Germany) + Holly Barnard (CU Boulder, US) on
Waters above + below ground:
How root uptake, transpiration, + subsurface stormflow connect drought, floods, ecosystems?
Register: psu.zoom.us/meeting/regi...
@waterbarnes.bsky.social

November 12, 2025 at 9:56 PM
Last #WARR in 2025!!
Drs. Theresa Blume (GFZ, Germany) + Holly Barnard (CU Boulder, US) on
Waters above + below ground:
How root uptake, transpiration, + subsurface stormflow connect drought, floods, ecosystems?
Register: psu.zoom.us/meeting/regi...
@waterbarnes.bsky.social
Drs. Theresa Blume (GFZ, Germany) + Holly Barnard (CU Boulder, US) on
Waters above + below ground:
How root uptake, transpiration, + subsurface stormflow connect drought, floods, ecosystems?
Register: psu.zoom.us/meeting/regi...
@waterbarnes.bsky.social
Reposted by Matthias Sprenger
We wrote the Strain on scientific publishing to highlight the problems of time & trust. With a fantastic group of co-authors, we present The Drain of Scientific Publishing:
a 🧵 1/n
Drain: arxiv.org/abs/2511.04820
Strain: direct.mit.edu/qss/article/...
Oligopoly: direct.mit.edu/qss/article/...
a 🧵 1/n
Drain: arxiv.org/abs/2511.04820
Strain: direct.mit.edu/qss/article/...
Oligopoly: direct.mit.edu/qss/article/...


November 11, 2025 at 11:52 AM
We wrote the Strain on scientific publishing to highlight the problems of time & trust. With a fantastic group of co-authors, we present The Drain of Scientific Publishing:
a 🧵 1/n
Drain: arxiv.org/abs/2511.04820
Strain: direct.mit.edu/qss/article/...
Oligopoly: direct.mit.edu/qss/article/...
a 🧵 1/n
Drain: arxiv.org/abs/2511.04820
Strain: direct.mit.edu/qss/article/...
Oligopoly: direct.mit.edu/qss/article/...
Reposted by Matthias Sprenger
The Drain of Scientific Publishing details very clearly how for-profit publishers making >30% profit margins have corrupted any solution the research community has attempted.
Let's cut ourselves free.
Drain: arxiv.org/abs/2511.04820
Strain: bit.ly/StrainQSS
Oligopoly: bit.ly/OligSciPub
12/12
Let's cut ourselves free.
Drain: arxiv.org/abs/2511.04820
Strain: bit.ly/StrainQSS
Oligopoly: bit.ly/OligSciPub
12/12

The Drain of Scientific Publishing
The domination of scientific publishing in the Global North by major commercial publishers is harmful to science. We need the most powerful members of the research community, funders, governments and ...
arxiv.org
November 11, 2025 at 11:52 AM
The Drain of Scientific Publishing details very clearly how for-profit publishers making >30% profit margins have corrupted any solution the research community has attempted.
Let's cut ourselves free.
Drain: arxiv.org/abs/2511.04820
Strain: bit.ly/StrainQSS
Oligopoly: bit.ly/OligSciPub
12/12
Let's cut ourselves free.
Drain: arxiv.org/abs/2511.04820
Strain: bit.ly/StrainQSS
Oligopoly: bit.ly/OligSciPub
12/12
Reposted by Matthias Sprenger
Connect with us at #AGU25! The DS TC will be joining the Near Surface Geophysics section for an informal social, Wednesday, December 17, 7-9PM. Everyone is welcome! Mark your calendar & stay tuned for details. 🎉
Provide a tentative RSVP to help us plan:
Provide a tentative RSVP to help us plan:

RSVP: AGU25 DSTC Social Event
Please let us know if you are likely to attend the social event at The Rusty Nail on Wednesday (Dec.17) from 7-9pm. This will be a joint social with the Near Surface Geophysics Session and we need…
docs.google.com
November 11, 2025 at 11:30 PM
Connect with us at #AGU25! The DS TC will be joining the Near Surface Geophysics section for an informal social, Wednesday, December 17, 7-9PM. Everyone is welcome! Mark your calendar & stay tuned for details. 🎉
Provide a tentative RSVP to help us plan:
Provide a tentative RSVP to help us plan:
Reposted by Matthias Sprenger
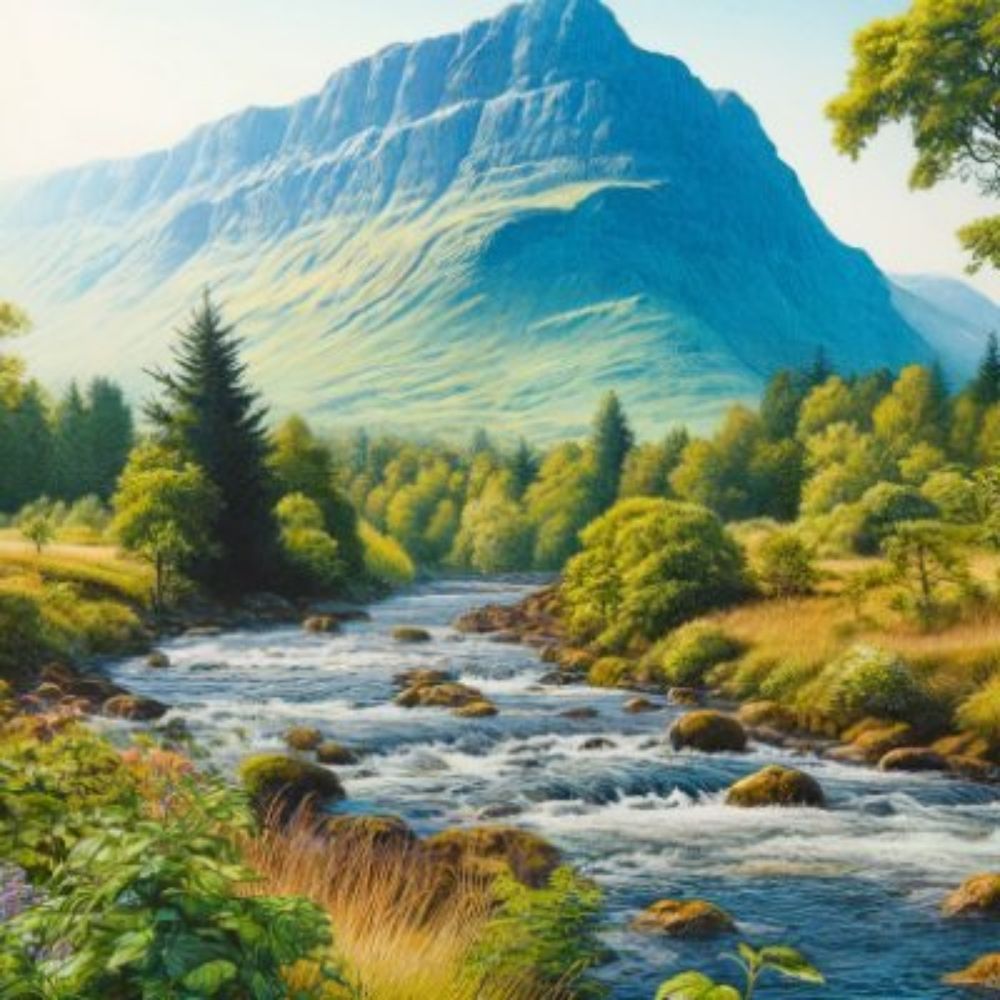
This week in our #AGU25 #CatchmentHydrology Early Career series, we highlight: “Effects of Climate Change on the Hydrological Regime of a Mountainous Catchment: A Case Study from the Hindu Kush Himalayan Region” by
Malla Mani Kanta et al. (2025).
Malla Mani Kanta et al. (2025).

November 10, 2025 at 2:37 PM
This week in our #AGU25 #CatchmentHydrology Early Career series, we highlight: “Effects of Climate Change on the Hydrological Regime of a Mountainous Catchment: A Case Study from the Hindu Kush Himalayan Region” by
Malla Mani Kanta et al. (2025).
Malla Mani Kanta et al. (2025).
Reposted by Matthias Sprenger
Graphical Abstracts are my passion 08 Aug 2025 ($3090.00 APC)

August 10, 2025 at 10:55 PM
Graphical Abstracts are my passion 08 Aug 2025 ($3090.00 APC)
Reposted by Matthias Sprenger

Improving the representation of plant water stress and water use in Earth System Models
Dukes et al. @dukesjeff.bsky.social @changliao.bsky.social @richphillipslab.bsky.social @scottmcadam.bsky.social
nph.onlinelibrary.wiley.com/doi/10.1111/...
Dukes et al. @dukesjeff.bsky.social @changliao.bsky.social @richphillipslab.bsky.social @scottmcadam.bsky.social
nph.onlinelibrary.wiley.com/doi/10.1111/...

November 5, 2025 at 3:35 PM
Improving the representation of plant water stress and water use in Earth System Models
Dukes et al. @dukesjeff.bsky.social @changliao.bsky.social @richphillipslab.bsky.social @scottmcadam.bsky.social
nph.onlinelibrary.wiley.com/doi/10.1111/...
Dukes et al. @dukesjeff.bsky.social @changliao.bsky.social @richphillipslab.bsky.social @scottmcadam.bsky.social
nph.onlinelibrary.wiley.com/doi/10.1111/...
Reposted by Matthias Sprenger
New Assistant Professor Posting:
@dartmouthears.bsky.social @dartmouthartsci.bsky.social
Stable Isotope Biogeochemistry and/or Geobiology
apply.interfolio.com/176517
🧪🌎
@dartmouthears.bsky.social @dartmouthartsci.bsky.social
Stable Isotope Biogeochemistry and/or Geobiology
apply.interfolio.com/176517
🧪🌎

November 5, 2025 at 4:41 PM
New Assistant Professor Posting:
@dartmouthears.bsky.social @dartmouthartsci.bsky.social
Stable Isotope Biogeochemistry and/or Geobiology
apply.interfolio.com/176517
🧪🌎
@dartmouthears.bsky.social @dartmouthartsci.bsky.social
Stable Isotope Biogeochemistry and/or Geobiology
apply.interfolio.com/176517
🧪🌎
Reposted by Matthias Sprenger
Amid all happy election results tonight, here’s one that’s giving me joy: my friend & colleague @louierivers3.bsky.social was elected to the Chapel Hill city council!
“His campaign priorities included preparing for climate change, expanding housing opportunities and expanding community engagement.”
“His campaign priorities included preparing for climate change, expanding housing opportunities and expanding community engagement.”
November 5, 2025 at 4:16 AM
Amid all happy election results tonight, here’s one that’s giving me joy: my friend & colleague @louierivers3.bsky.social was elected to the Chapel Hill city council!
“His campaign priorities included preparing for climate change, expanding housing opportunities and expanding community engagement.”
“His campaign priorities included preparing for climate change, expanding housing opportunities and expanding community engagement.”
Reposted by Matthias Sprenger
🚨Calling all #TreeRing lovers!🚨
Join us at #EGU26 for session CL1.2.1 Interdisciplinary Tree-Ring Research
Abstracts exploring tree rings from all perspectives and disciplines are welcome!
Submit here:
tinyurl.com/475xjjfu
K. Treydte, J. Jevšenak, A. Eckes-Shephard, @pieterzuidema.bsky.social
Join us at #EGU26 for session CL1.2.1 Interdisciplinary Tree-Ring Research
Abstracts exploring tree rings from all perspectives and disciplines are welcome!
Submit here:
tinyurl.com/475xjjfu
K. Treydte, J. Jevšenak, A. Eckes-Shephard, @pieterzuidema.bsky.social

November 5, 2025 at 6:36 AM
🚨Calling all #TreeRing lovers!🚨
Join us at #EGU26 for session CL1.2.1 Interdisciplinary Tree-Ring Research
Abstracts exploring tree rings from all perspectives and disciplines are welcome!
Submit here:
tinyurl.com/475xjjfu
K. Treydte, J. Jevšenak, A. Eckes-Shephard, @pieterzuidema.bsky.social
Join us at #EGU26 for session CL1.2.1 Interdisciplinary Tree-Ring Research
Abstracts exploring tree rings from all perspectives and disciplines are welcome!
Submit here:
tinyurl.com/475xjjfu
K. Treydte, J. Jevšenak, A. Eckes-Shephard, @pieterzuidema.bsky.social
P.C.D. (“Chris”) Milly, Horton Medal Awardee 2024:
"That prioritization of scientific career over private life stings even more as I’ve realized how our science is sometimes ignored anyway—or applied only selectively—to favor powerful, capitalist interests instead of a
sustainable common good."
"That prioritization of scientific career over private life stings even more as I’ve realized how our science is sometimes ignored anyway—or applied only selectively—to favor powerful, capitalist interests instead of a
sustainable common good."
November 3, 2025 at 8:57 PM
P.C.D. (“Chris”) Milly, Horton Medal Awardee 2024:
"That prioritization of scientific career over private life stings even more as I’ve realized how our science is sometimes ignored anyway—or applied only selectively—to favor powerful, capitalist interests instead of a
sustainable common good."
"That prioritization of scientific career over private life stings even more as I’ve realized how our science is sometimes ignored anyway—or applied only selectively—to favor powerful, capitalist interests instead of a
sustainable common good."
Reposted by Matthias Sprenger
Some charts for those who don't know the extent of the US public (and private) investment in research (particularly in biomedical research) compared to other countries and institutions. The destruction of the US' scientific institutions has global implications.


November 2, 2025 at 10:52 AM
Some charts for those who don't know the extent of the US public (and private) investment in research (particularly in biomedical research) compared to other countries and institutions. The destruction of the US' scientific institutions has global implications.