


Erik
@nerik.bsky.social
Maps, dataviz, renewables, climate, oceans, forests ❈ Dataviz engineer @ Octopus Energy
❈ Founder http://satellitestud.io
❈ Founder http://satellitestud.io
Reposted by Erik

👍 Good news from new @ember-energy.org research: wind and solar overtook fossil fuels in the EU electricity mix for the first time ever in 2025.
🌪️ and ☀️ made up a record 30% of 🇪🇺 electricity, up from 20% just five years ago.
Read the full electricity review below 👇
ember-energy.org/latest-insig...
🌪️ and ☀️ made up a record 30% of 🇪🇺 electricity, up from 20% just five years ago.
Read the full electricity review below 👇
ember-energy.org/latest-insig...

January 22, 2026 at 9:04 AM
👍 Good news from new @ember-energy.org research: wind and solar overtook fossil fuels in the EU electricity mix for the first time ever in 2025.
🌪️ and ☀️ made up a record 30% of 🇪🇺 electricity, up from 20% just five years ago.
Read the full electricity review below 👇
ember-energy.org/latest-insig...
🌪️ and ☀️ made up a record 30% of 🇪🇺 electricity, up from 20% just five years ago.
Read the full electricity review below 👇
ember-energy.org/latest-insig...
Reposted by Erik

Brother Warnock lays it plain.
November 6, 2025 at 11:46 PM
Brother Warnock lays it plain.
Reposted by Erik

"World's first potential trillionaire has killed 600,000 people, including 400,000 children" is the only headline that anyone should ever read about Elon Musk

One analytical model shows that, as of November 5th, the dismantling of U.S.A.I.D. has already caused the deaths of 600,000 people, two-thirds of them children. https://newyorkermag.visitlink.me/jUzNSc

The Shutdown of U.S.A.I.D. Has Already Killed Hundreds of Thousands
The short documentary “Rovina’s Choice” tells the story of what goes when aid goes.
newyorkermag.visitlink.me
November 7, 2025 at 1:33 AM
"World's first potential trillionaire has killed 600,000 people, including 400,000 children" is the only headline that anyone should ever read about Elon Musk
Reposted by Erik
Some good news: Brazil's fight against deforestation is paying climate dividends.

Brazil records biggest annual fall in emissions in 15 years, notably thanks to fight against deforestation
The gross emissions of Latin America's biggest country fell by 16.7% year-on-year, according to Brazil's Climate Observatory, a network of environmental NGOs.
www.lemonde.fr
November 4, 2025 at 9:04 PM
Some good news: Brazil's fight against deforestation is paying climate dividends.
My jaw literally dropped when I checked out @ignfrance.bsky.social's BD TOPO (high precision database of French infrastructure, here in vector format). Last time I checked (years ago admittedly), this was something that cost several thousands euros for a single département.

June 11, 2025 at 9:09 AM
My jaw literally dropped when I checked out @ignfrance.bsky.social's BD TOPO (high precision database of French infrastructure, here in vector format). Last time I checked (years ago admittedly), this was something that cost several thousands euros for a single département.
In these turbulent times—while the galaxy reels from crisis to crisis—sometimes the only way forward… is sideways, into Star Wars canon. A timeline of every Star Wars show, charted in story-order from the dawn of the Republic to the First Order. #DarthJarJar #StarWars #MayThe4th #Andor #dataviz
April 23, 2025 at 11:56 AM
In these turbulent times—while the galaxy reels from crisis to crisis—sometimes the only way forward… is sideways, into Star Wars canon. A timeline of every Star Wars show, charted in story-order from the dawn of the Republic to the First Order. #DarthJarJar #StarWars #MayThe4th #Andor #dataviz
Reposted by Erik

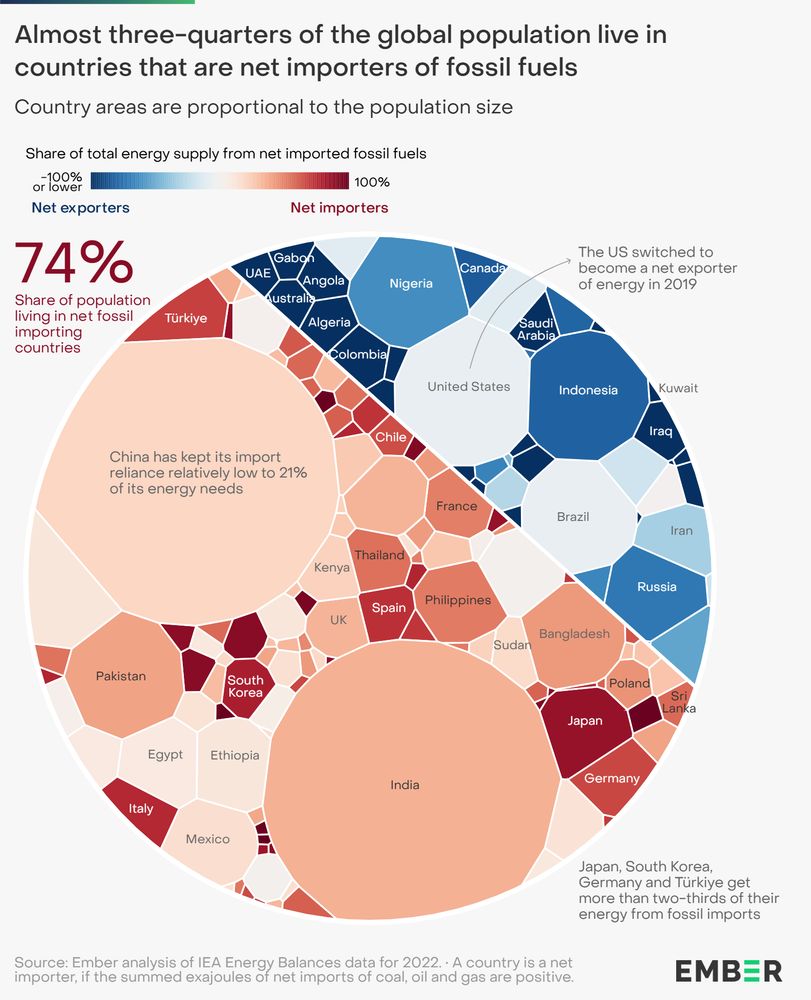
NEW | 74% of the global population lives in countries that are net importers of fossil fuels.
12 countries supply 80% of net fossil fuel exports - with rising trade uncertainty, this puts much of the world at risk.
1/8 🧵
ember-energy.org/lat...
12 countries supply 80% of net fossil fuel exports - with rising trade uncertainty, this puts much of the world at risk.
1/8 🧵
ember-energy.org/lat...
April 22, 2025 at 7:00 AM
NEW | 74% of the global population lives in countries that are net importers of fossil fuels.
12 countries supply 80% of net fossil fuel exports - with rising trade uncertainty, this puts much of the world at risk.
1/8 🧵
ember-energy.org/lat...
12 countries supply 80% of net fossil fuel exports - with rising trade uncertainty, this puts much of the world at risk.
1/8 🧵
ember-energy.org/lat...
Reposted by Erik

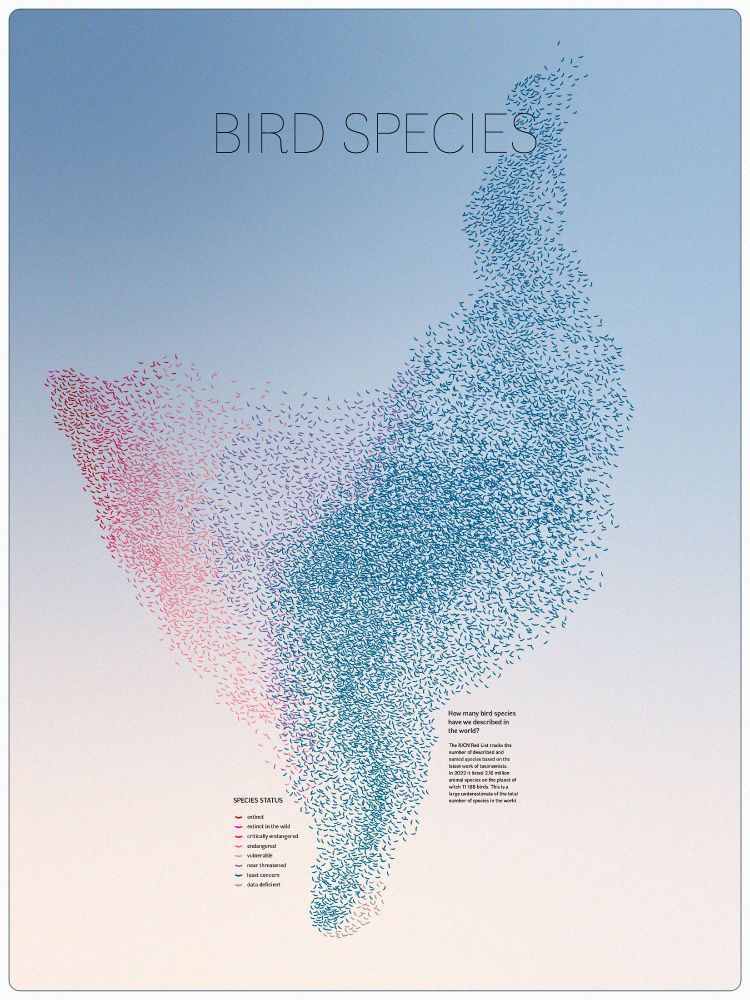
This dataviz is absolutely amazing 😍 Global bird species' conservation status displayed as a massive flock!
By Andrea Garrec, longlisted for the 2024 Information Is Beautiful Awards
www.informationisbeautifulawards.com/showcase/731...
#dataviz 📊🌏🧪🐦🦉🦆🦅
By Andrea Garrec, longlisted for the 2024 Information Is Beautiful Awards
www.informationisbeautifulawards.com/showcase/731...
#dataviz 📊🌏🧪🐦🦉🦆🦅
March 19, 2025 at 2:40 AM
This dataviz is absolutely amazing 😍 Global bird species' conservation status displayed as a massive flock!
By Andrea Garrec, longlisted for the 2024 Information Is Beautiful Awards
www.informationisbeautifulawards.com/showcase/731...
#dataviz 📊🌏🧪🐦🦉🦆🦅
By Andrea Garrec, longlisted for the 2024 Information Is Beautiful Awards
www.informationisbeautifulawards.com/showcase/731...
#dataviz 📊🌏🧪🐦🦉🦆🦅
Reposted by Erik
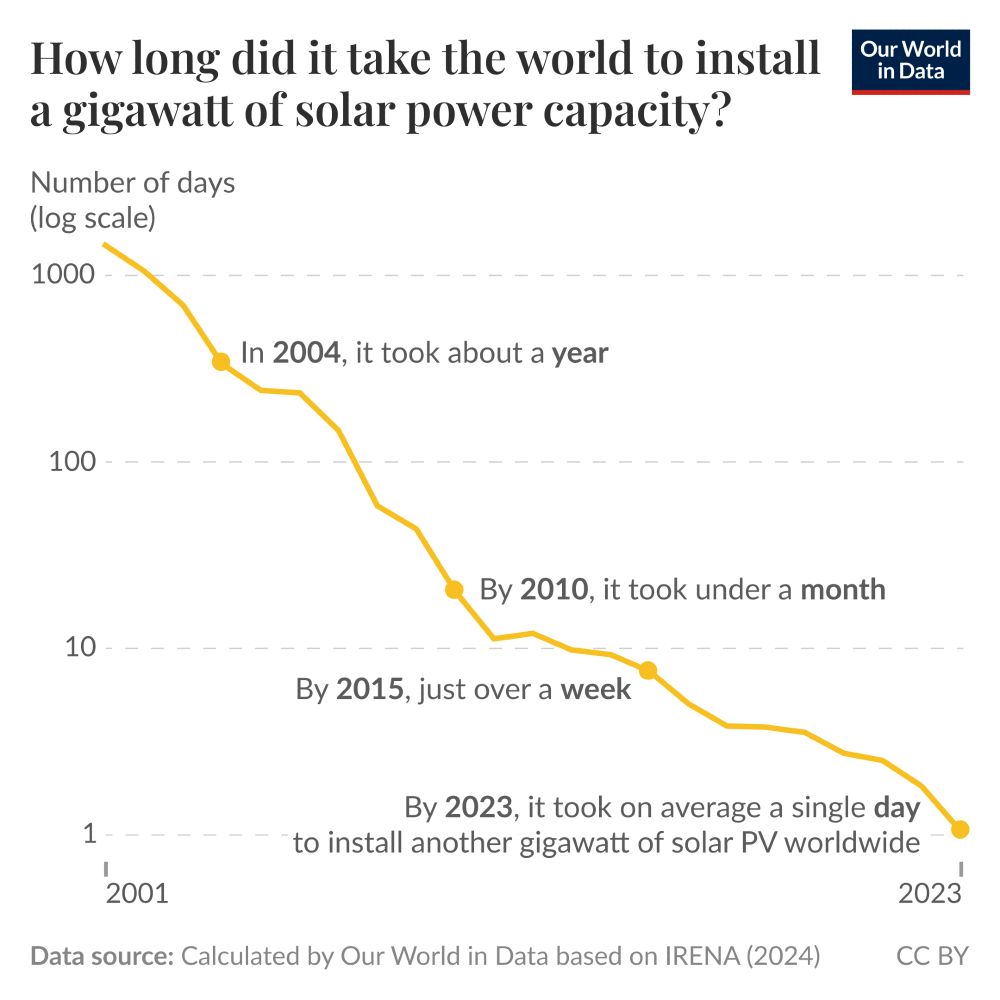
In 2004, it took the world a year to add one gigawatt of solar power — now it takes a day.
March 18, 2025 at 10:41 AM
In 2004, it took the world a year to add one gigawatt of solar power — now it takes a day.
Extremely enjoyable progression so far... Which one should be next?

March 14, 2025 at 2:32 PM
Extremely enjoyable progression so far... Which one should be next?
I'm afraid I'm going down this rabbit hole of building physical data viz with Lego. #midlifeCrisis
Expect stop motion builds of wind turbines, EV vs petrol car (bar chart) races, me piling up yellow bricks to explain solar autoconsumption, and more 😁
Expect stop motion builds of wind turbines, EV vs petrol car (bar chart) races, me piling up yellow bricks to explain solar autoconsumption, and more 😁


March 5, 2025 at 11:59 AM
I'm afraid I'm going down this rabbit hole of building physical data viz with Lego. #midlifeCrisis
Expect stop motion builds of wind turbines, EV vs petrol car (bar chart) races, me piling up yellow bricks to explain solar autoconsumption, and more 😁
Expect stop motion builds of wind turbines, EV vs petrol car (bar chart) races, me piling up yellow bricks to explain solar autoconsumption, and more 😁
Reposted by Erik

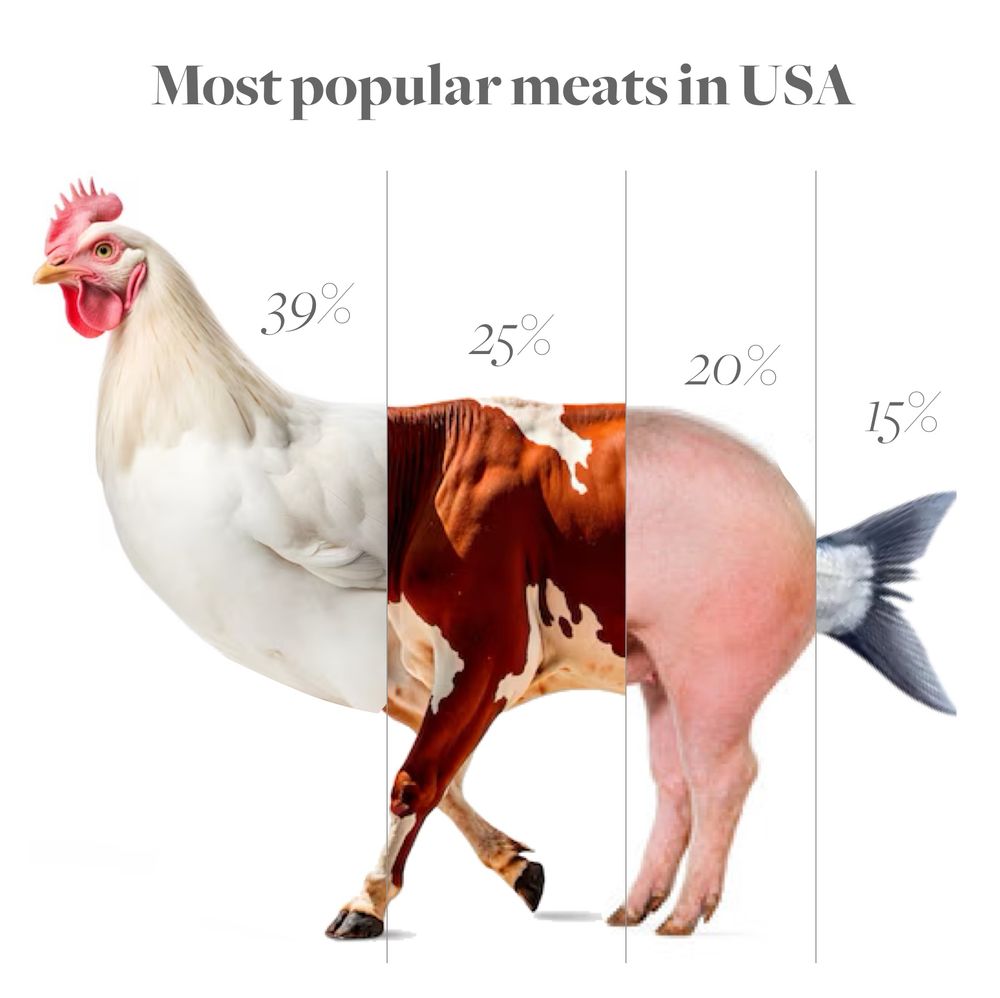
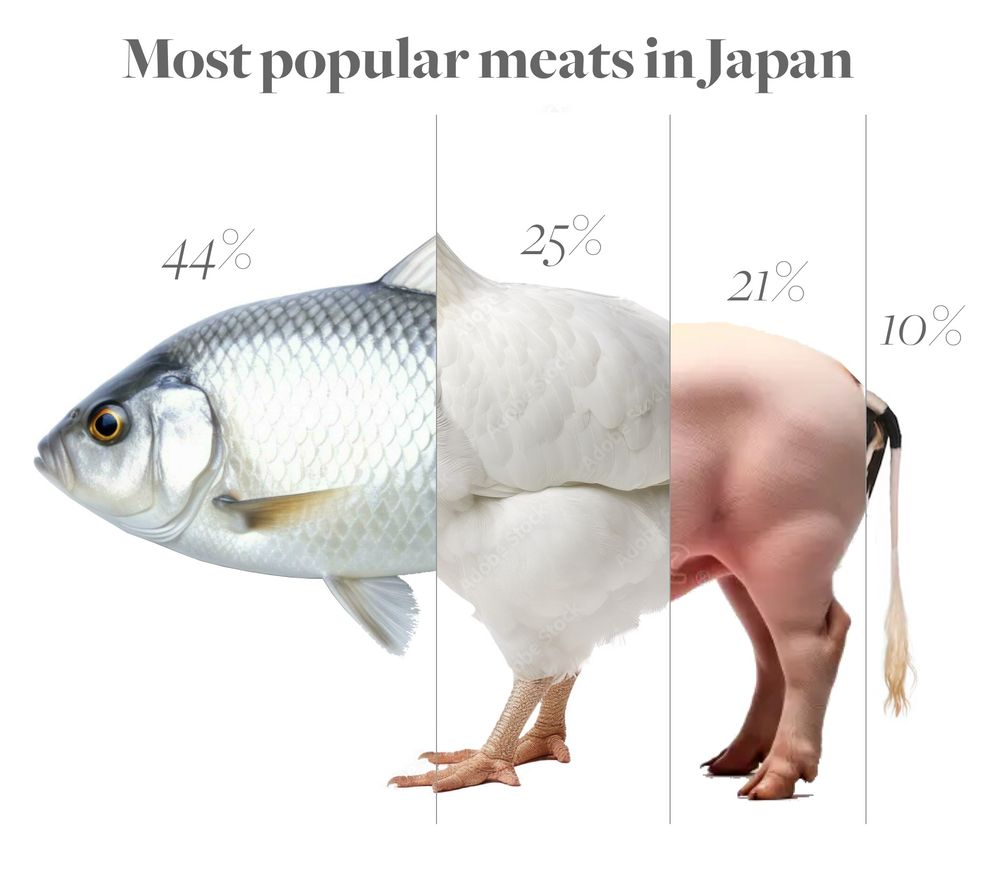
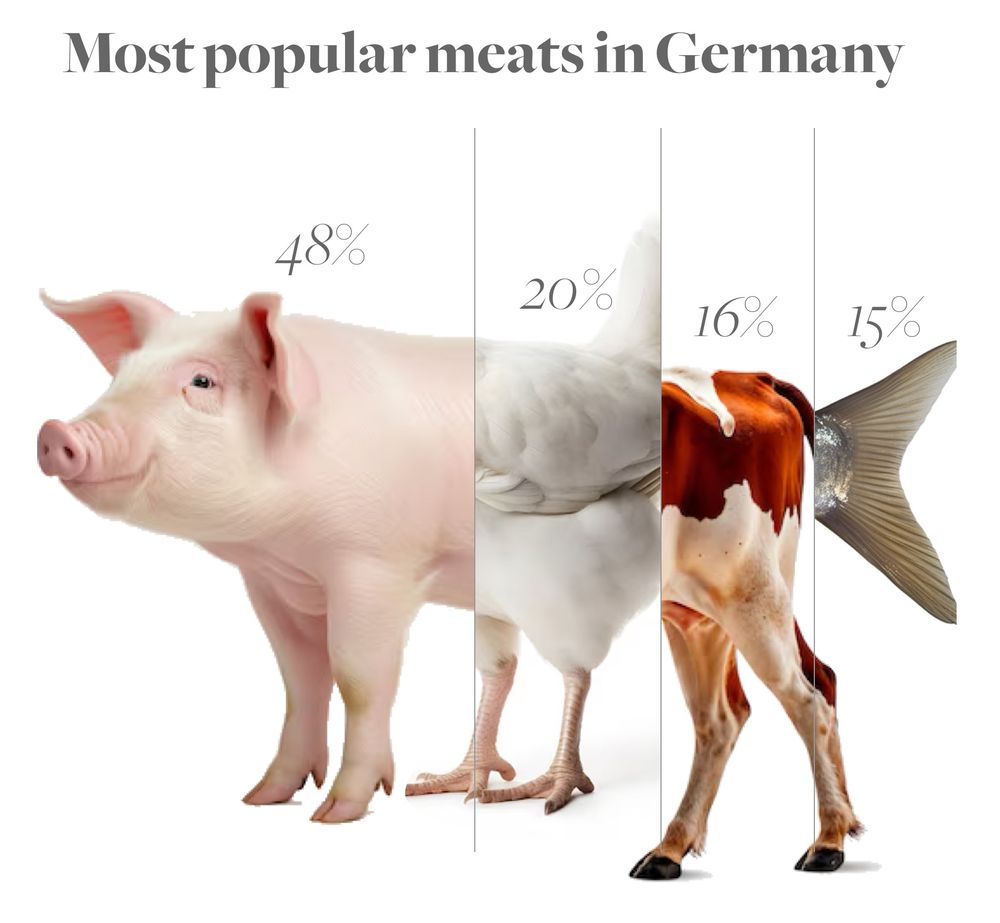
Ever wondered what a country’s meat supply looks like? 🍗🐄🐖🐟
Here’s a breakdown of meat preferences in Japan, the US & Germany—visualized as hybrid animals! A fun (and slightly cursed) way to see food stats. 🧵👇
Here’s a breakdown of meat preferences in Japan, the US & Germany—visualized as hybrid animals! A fun (and slightly cursed) way to see food stats. 🧵👇
February 2, 2025 at 11:24 AM
Ever wondered what a country’s meat supply looks like? 🍗🐄🐖🐟
Here’s a breakdown of meat preferences in Japan, the US & Germany—visualized as hybrid animals! A fun (and slightly cursed) way to see food stats. 🧵👇
Here’s a breakdown of meat preferences in Japan, the US & Germany—visualized as hybrid animals! A fun (and slightly cursed) way to see food stats. 🧵👇
Reposted by Erik

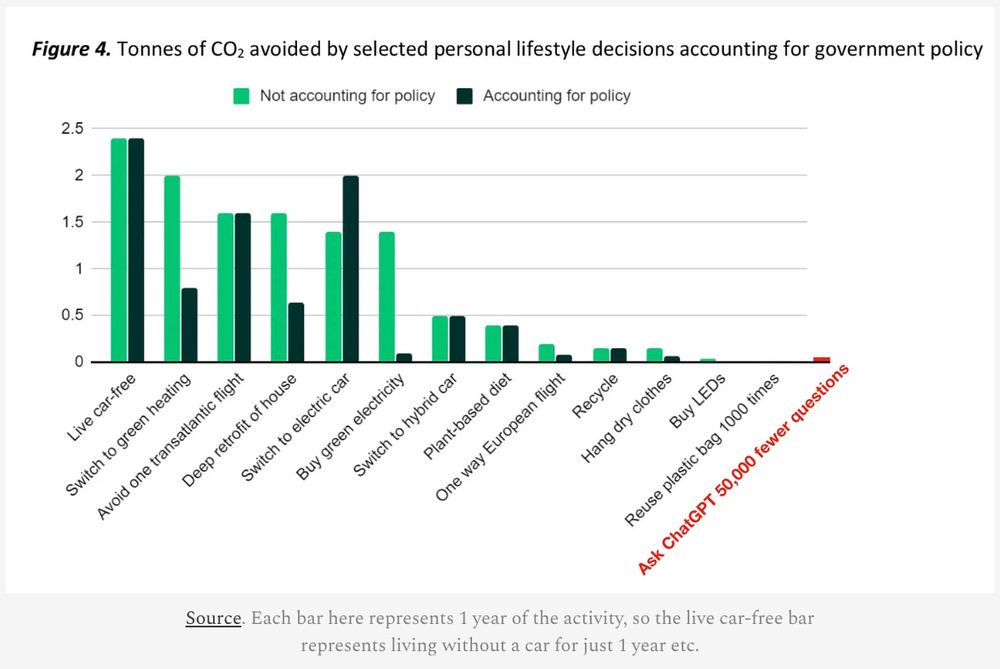
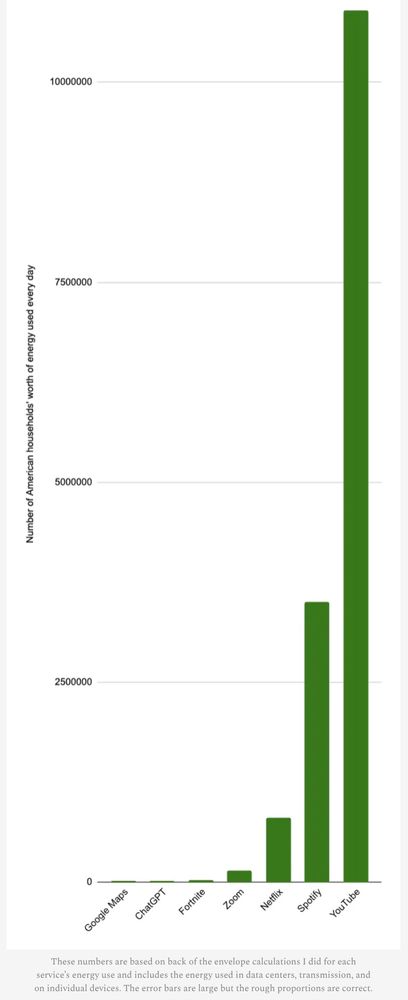
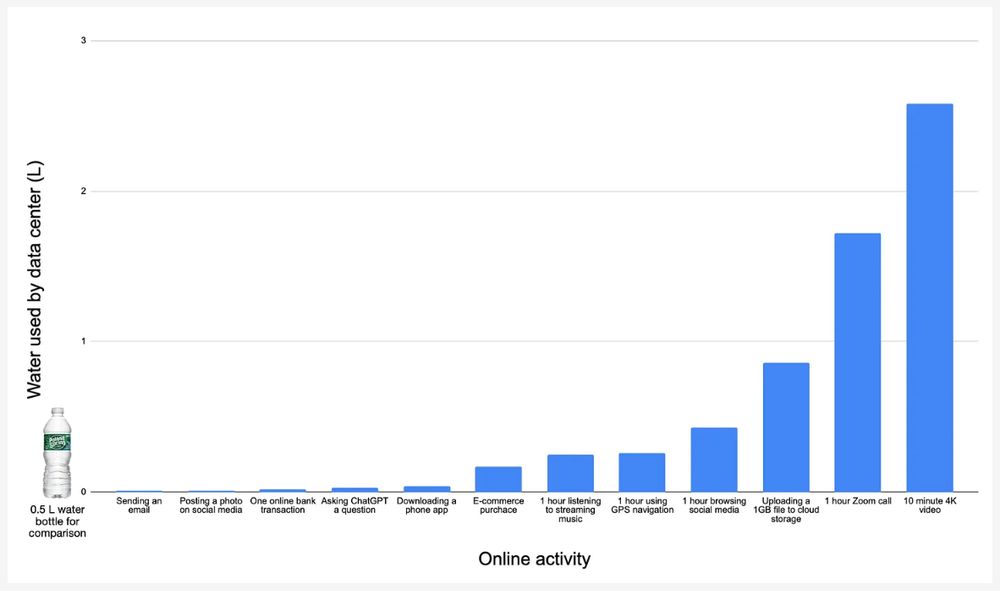
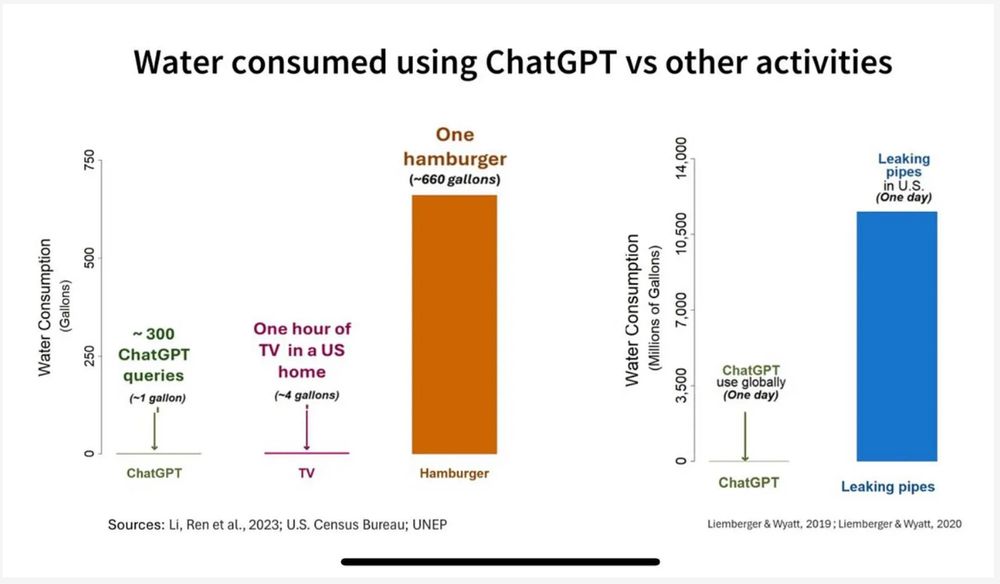
Why it's okay to use ChatGPT, in 4 graphs
January 14, 2025 at 7:24 PM
Why it's okay to use ChatGPT, in 4 graphs
Stoked to announce that I joined Octopus Energy as a Data Visualisation Engineer last December! (yes, better outrageously late than never)


May 15, 2024 at 2:35 PM
Stoked to announce that I joined Octopus Energy as a Data Visualisation Engineer last December! (yes, better outrageously late than never)
Reposted by Erik

I’ve decided to dedicate myself full time to earth.nullschool.net. There is much work to do! In particular, I’m going to explore ways for the site to help fight climate change. More on this in the near future.
It’s been an amazing 10 years. Here’s hoping for 10 more. 🎉
It’s been an amazing 10 years. Here’s hoping for 10 more. 🎉


December 9, 2023 at 3:00 PM
I’ve decided to dedicate myself full time to earth.nullschool.net. There is much work to do! In particular, I’m going to explore ways for the site to help fight climate change. More on this in the near future.
It’s been an amazing 10 years. Here’s hoping for 10 more. 🎉
It’s been an amazing 10 years. Here’s hoping for 10 more. 🎉
Reposted by Erik

Did you know? The United States depends on a little more than 5% of its counties to produce half of the crops consumers eat.
We helped build the Plotline Food Twin project alongside CU Boulder and Earth Genome researchers to visualize the U.S. food system.
Article: www.colorado.edu/today/2023/1...
We helped build the Plotline Food Twin project alongside CU Boulder and Earth Genome researchers to visualize the U.S. food system.
Article: www.colorado.edu/today/2023/1...
November 28, 2023 at 4:10 PM
Did you know? The United States depends on a little more than 5% of its counties to produce half of the crops consumers eat.
We helped build the Plotline Food Twin project alongside CU Boulder and Earth Genome researchers to visualize the U.S. food system.
Article: www.colorado.edu/today/2023/1...
We helped build the Plotline Food Twin project alongside CU Boulder and Earth Genome researchers to visualize the U.S. food system.
Article: www.colorado.edu/today/2023/1...
On my way to Edinburgh for the Info+ conference!
Looking forward to talk about (fantasy) maps, books, politics, trains, data, design, accessibility, climate change, renewables, train maps, reading books on trains, accessible trains, train data. Trains!
Looking forward to talk about (fantasy) maps, books, politics, trains, data, design, accessibility, climate change, renewables, train maps, reading books on trains, accessible trains, train data. Trains!


November 21, 2023 at 5:55 PM
On my way to Edinburgh for the Info+ conference!
Looking forward to talk about (fantasy) maps, books, politics, trains, data, design, accessibility, climate change, renewables, train maps, reading books on trains, accessible trains, train data. Trains!
Looking forward to talk about (fantasy) maps, books, politics, trains, data, design, accessibility, climate change, renewables, train maps, reading books on trains, accessible trains, train data. Trains!
Reposted by Erik
Wind and solar power have taken off over the past two decades, faster than experts ever expected. But it hasn’t yet been enough to halt the rise of coal- and gas-burning generation.
Explore all the trends, country-by-country, here: www.nytimes.com/interactive/...
Explore all the trends, country-by-country, here: www.nytimes.com/interactive/...

November 20, 2023 at 2:33 PM
Wind and solar power have taken off over the past two decades, faster than experts ever expected. But it hasn’t yet been enough to halt the rise of coal- and gas-burning generation.
Explore all the trends, country-by-country, here: www.nytimes.com/interactive/...
Explore all the trends, country-by-country, here: www.nytimes.com/interactive/...
Reposted by Erik

For the mathematicians in the room, that's the second derivative pointing in the right direction at last.
For the rest of us: bathtub overflowing, and we are no longer turning up the spigot even further.
Good news. Now, to get CO₂ emissions down, to zero.
www.carbonbrief.org/analysis-glo...
For the rest of us: bathtub overflowing, and we are no longer turning up the spigot even further.
Good news. Now, to get CO₂ emissions down, to zero.
www.carbonbrief.org/analysis-glo...

October 27, 2023 at 9:36 PM
For the mathematicians in the room, that's the second derivative pointing in the right direction at last.
For the rest of us: bathtub overflowing, and we are no longer turning up the spigot even further.
Good news. Now, to get CO₂ emissions down, to zero.
www.carbonbrief.org/analysis-glo...
For the rest of us: bathtub overflowing, and we are no longer turning up the spigot even further.
Good news. Now, to get CO₂ emissions down, to zero.
www.carbonbrief.org/analysis-glo...