


nigel holmes
@nigelblue.bsky.social
explanation graphics; author (latest: let’s get Infografit, 2025); happy to be alive! working on a book about visual language…perhaps ready in 2026
some of the contributors to my book are getting their copies already…and i haven’t seen it yet! rowland did a beautiful website for it: www.letsgetinfografit.com
have a look!
have a look!
September 3, 2025 at 6:09 PM
some of the contributors to my book are getting their copies already…and i haven’t seen it yet! rowland did a beautiful website for it: www.letsgetinfografit.com
have a look!
have a look!
Reposted by nigel holmes

my university's library sorts out old Time magazines, bound by year. And look! @nigelblue.bsky.social


September 3, 2025 at 8:15 AM
my university's library sorts out old Time magazines, bound by year. And look! @nigelblue.bsky.social
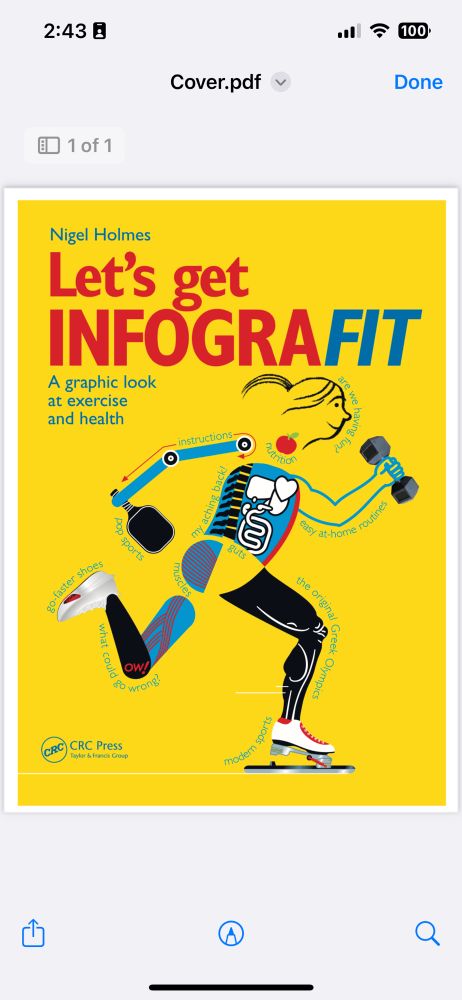
my book Let’s Get infografit is almost out (pub date sept 5); you can pre-order it at routledge/crc press and amazon. the preview there is for the ebook version; not quite the same as the real thing! oh well…here’s the cover:

August 14, 2025 at 9:12 PM
my book Let’s Get infografit is almost out (pub date sept 5); you can pre-order it at routledge/crc press and amazon. the preview there is for the ebook version; not quite the same as the real thing! oh well…here’s the cover:
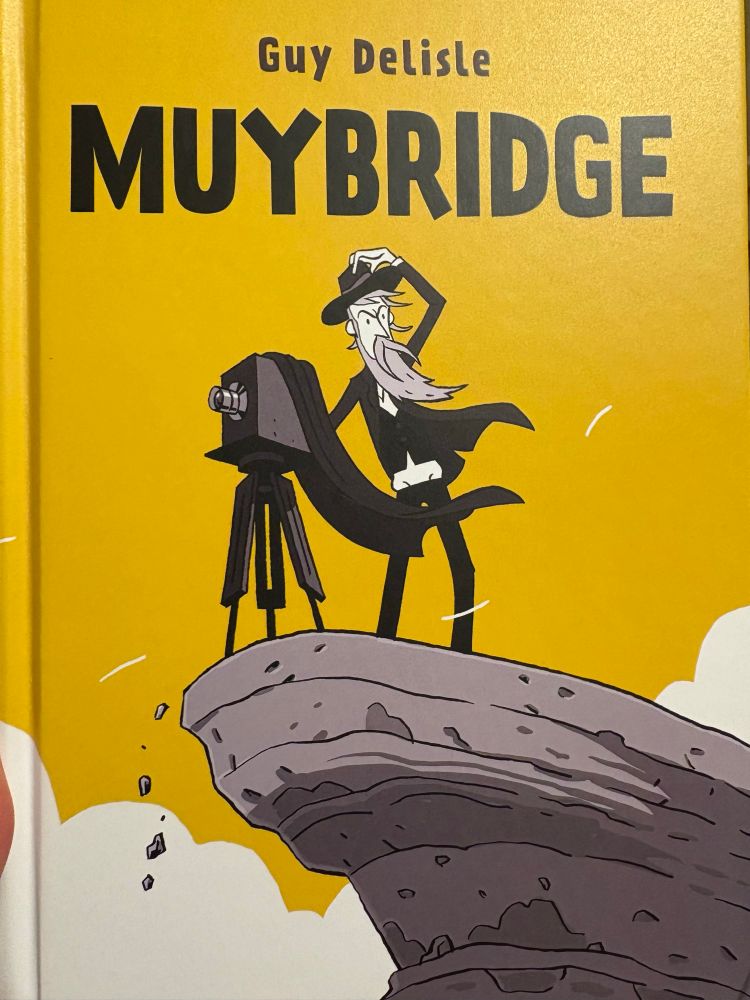
great book about an oddly great guy!
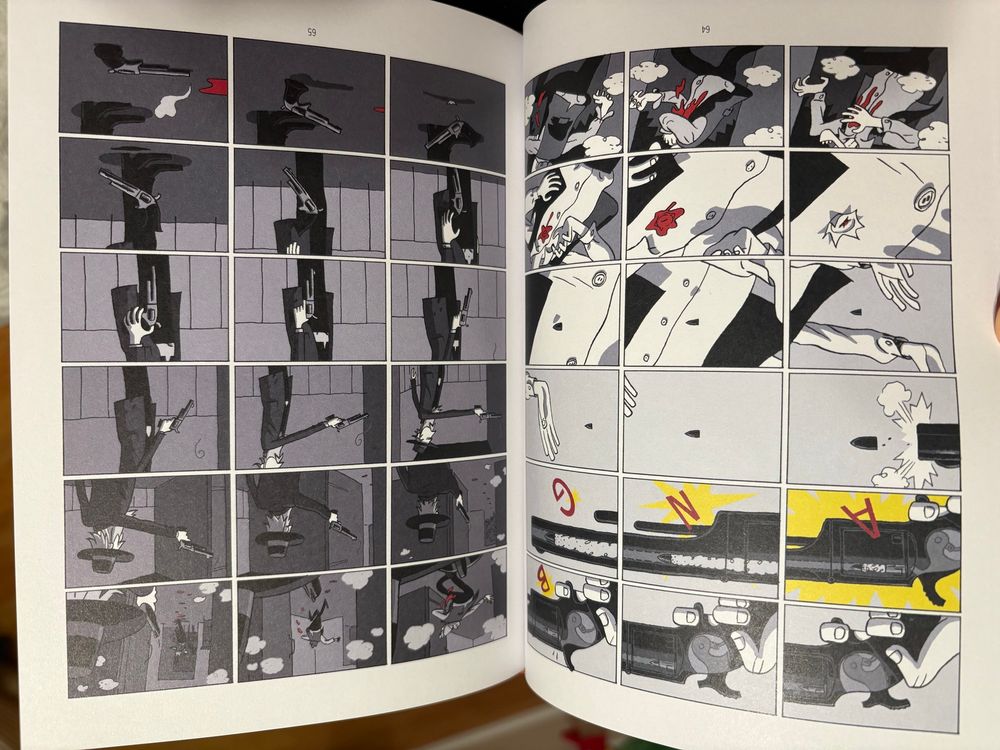
This was an absolutely great book! An amazing story, Guy Delisle dug deeply into the challenges, triumphs & horrific moments of Muybridge’s life, I learned a ton, was captivated for all of it. My dad got it first recommended - I hadn’t heard of it. Def recommend! From @dandq.bsky.social great stuff!
July 25, 2025 at 1:14 PM
great book about an oddly great guy!
Reposted by nigel holmes

This was an absolutely great book! An amazing story, Guy Delisle dug deeply into the challenges, triumphs & horrific moments of Muybridge’s life, I learned a ton, was captivated for all of it. My dad got it first recommended - I hadn’t heard of it. Def recommend! From @dandq.bsky.social great stuff!
July 17, 2025 at 11:53 PM
This was an absolutely great book! An amazing story, Guy Delisle dug deeply into the challenges, triumphs & horrific moments of Muybridge’s life, I learned a ton, was captivated for all of it. My dad got it first recommended - I hadn’t heard of it. Def recommend! From @dandq.bsky.social great stuff!
Reposted by nigel holmes

Combine Einstein (simple but not too simple) and @nigelblue.bsky.social (it's not about simplifying, it's about clarifying). Instead of simplifying q.b. and clarifying, you have a tool that forces you to go simpler and without options to clarify. It's unfixable, hence the cardification.
July 7, 2025 at 8:16 PM
Combine Einstein (simple but not too simple) and @nigelblue.bsky.social (it's not about simplifying, it's about clarifying). Instead of simplifying q.b. and clarifying, you have a tool that forces you to go simpler and without options to clarify. It's unfixable, hence the cardification.
Reposted by nigel holmes

#TodayinHistory #dataviz #OTD 📊
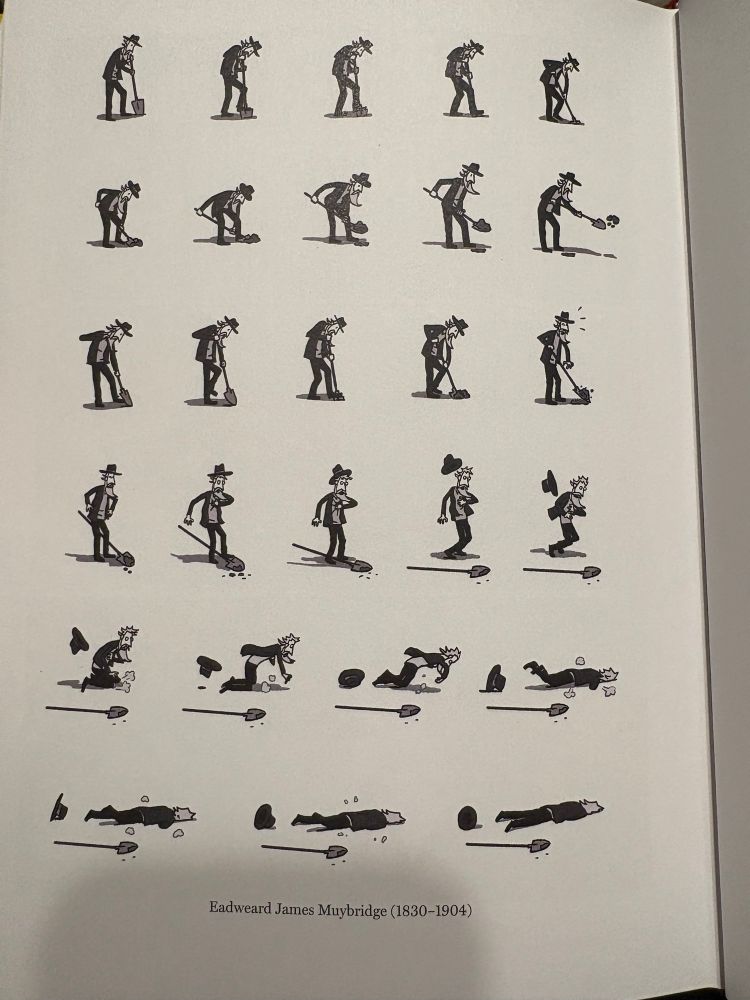
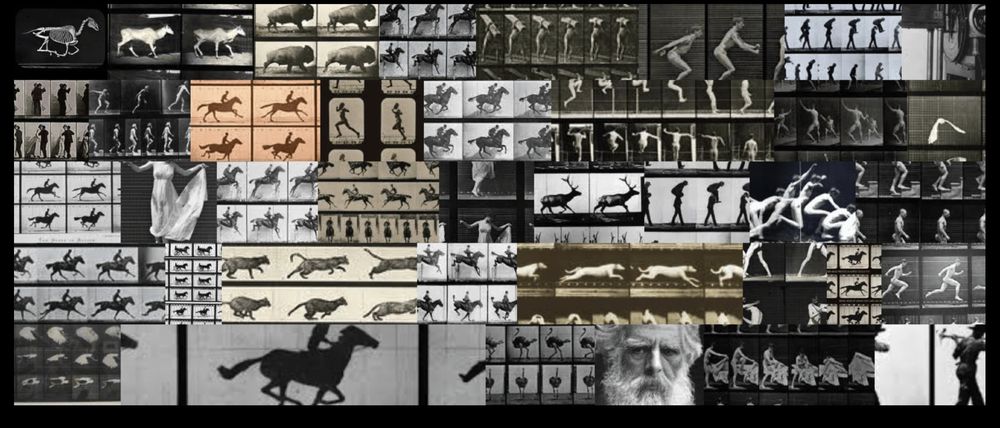
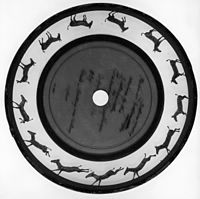
💀May 8, 1904 Eadweard Muybridge died in Kingston upon Thames, England 🇬🇧
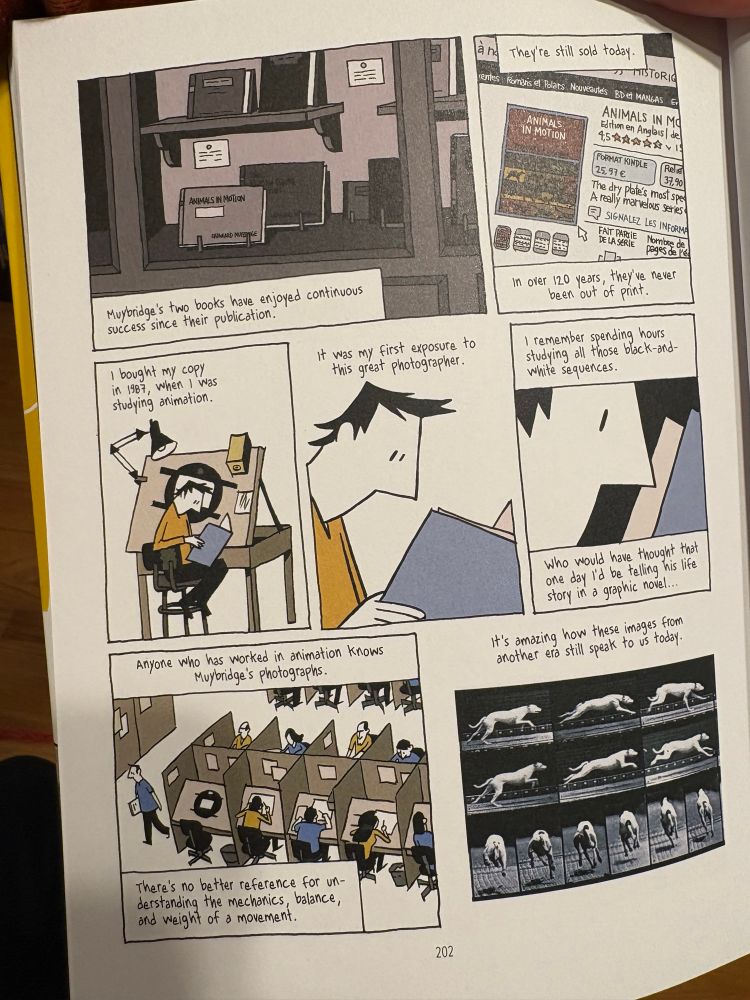
~ 1875 he developed a system for motion photography from a series of frames & pioneered the study of motion in humans and animals --a precursor of moving pictures & animated graphics.
💀May 8, 1904 Eadweard Muybridge died in Kingston upon Thames, England 🇬🇧
~ 1875 he developed a system for motion photography from a series of frames & pioneered the study of motion in humans and animals --a precursor of moving pictures & animated graphics.

May 9, 2025 at 12:41 AM
#TodayinHistory #dataviz #OTD 📊
💀May 8, 1904 Eadweard Muybridge died in Kingston upon Thames, England 🇬🇧
~ 1875 he developed a system for motion photography from a series of frames & pioneered the study of motion in humans and animals --a precursor of moving pictures & animated graphics.
💀May 8, 1904 Eadweard Muybridge died in Kingston upon Thames, England 🇬🇧
~ 1875 he developed a system for motion photography from a series of frames & pioneered the study of motion in humans and animals --a precursor of moving pictures & animated graphics.
Reposted by nigel holmes

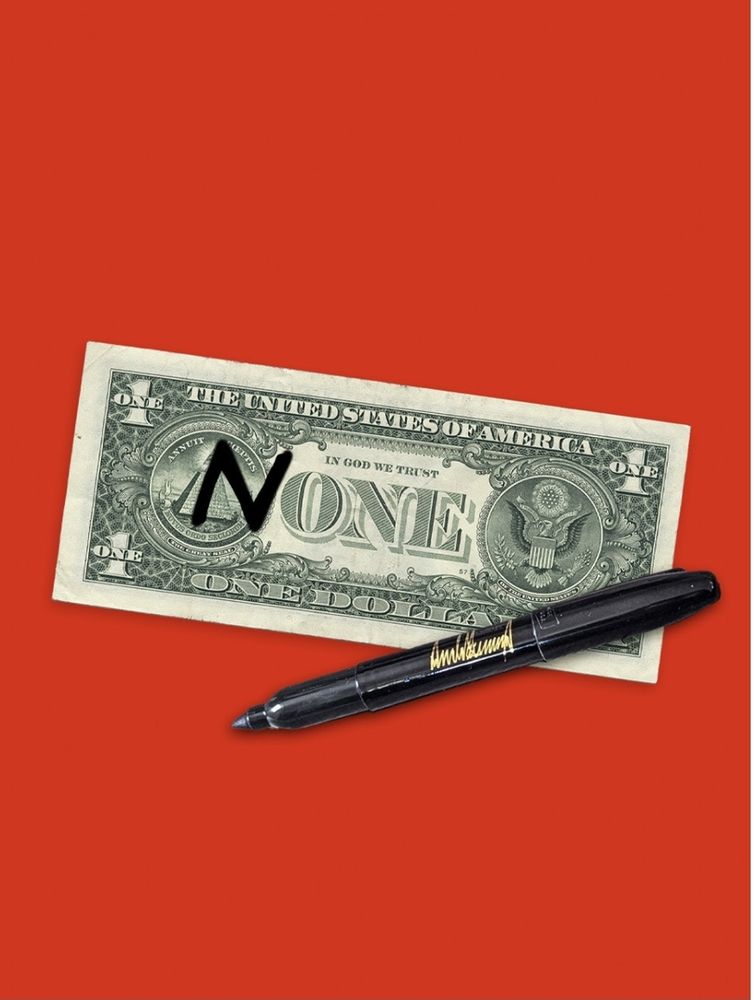
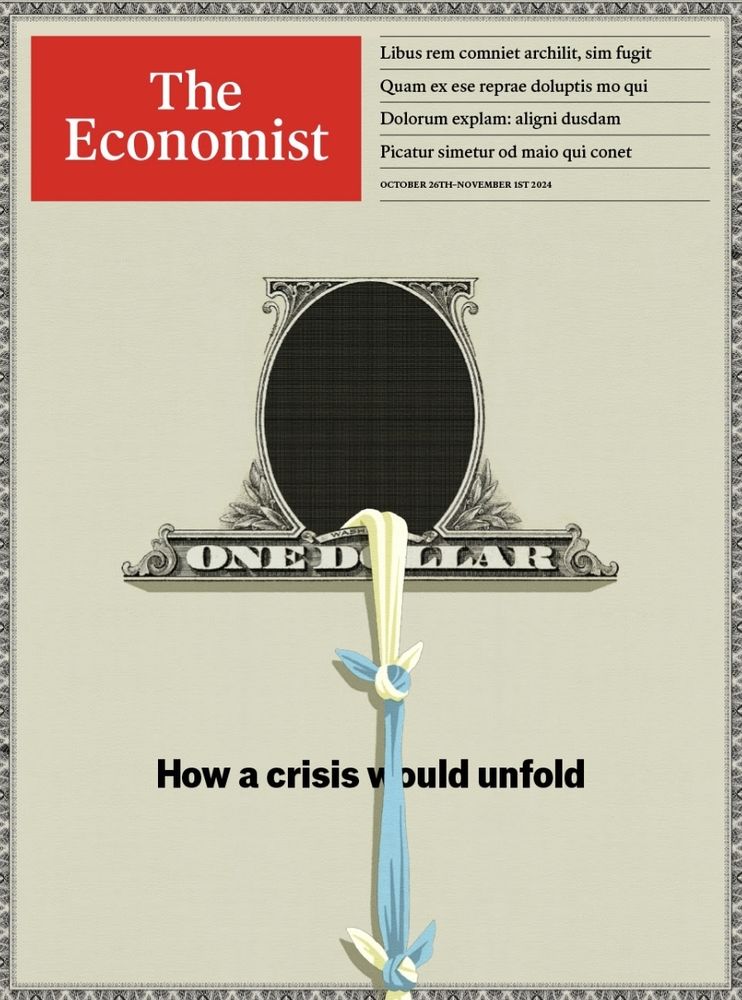
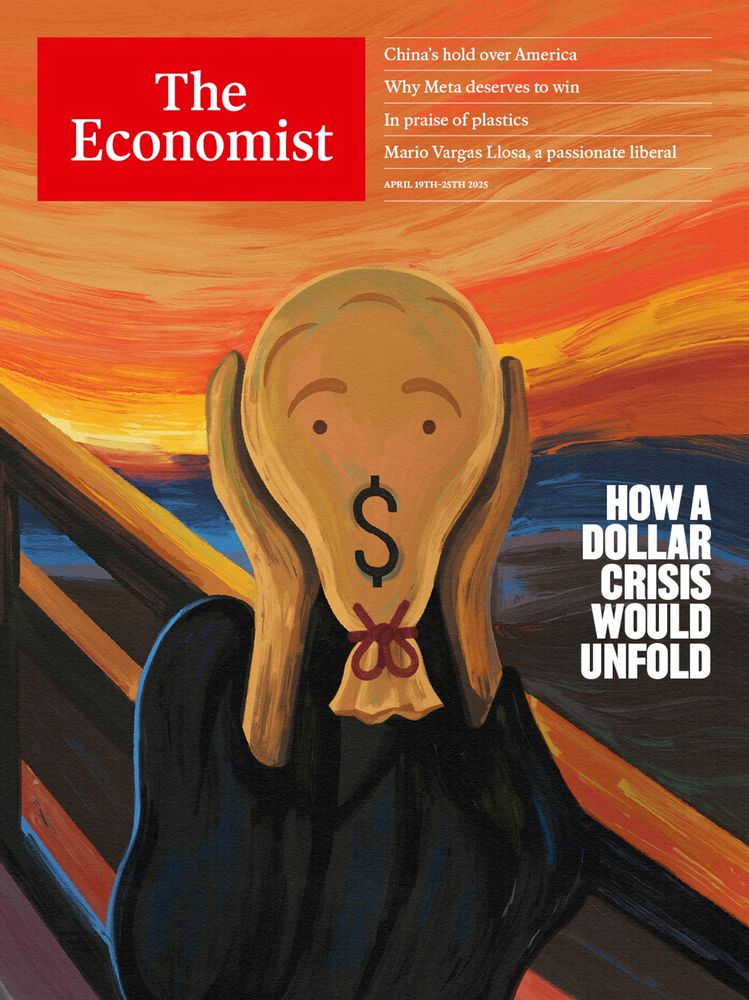
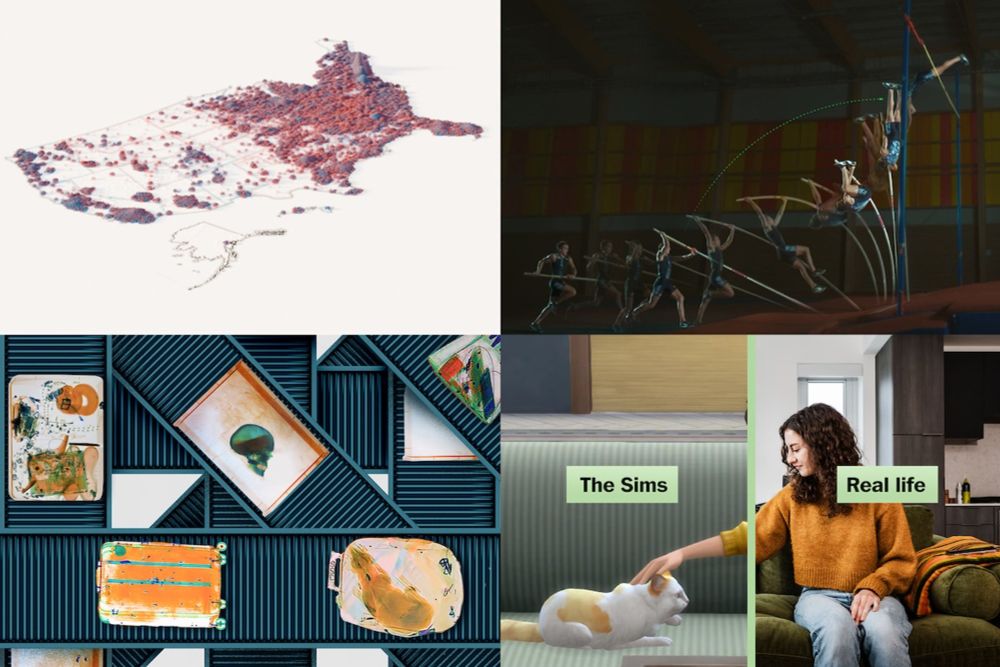
Some of the nice ideas that didn't make the cover of The Economist this week, and the one that did
economist.com/newsletters/cover-story
economist.com/newsletters/cover-story

April 19, 2025 at 5:32 PM
Some of the nice ideas that didn't make the cover of The Economist this week, and the one that did
economist.com/newsletters/cover-story
economist.com/newsletters/cover-story
Reposted by nigel holmes

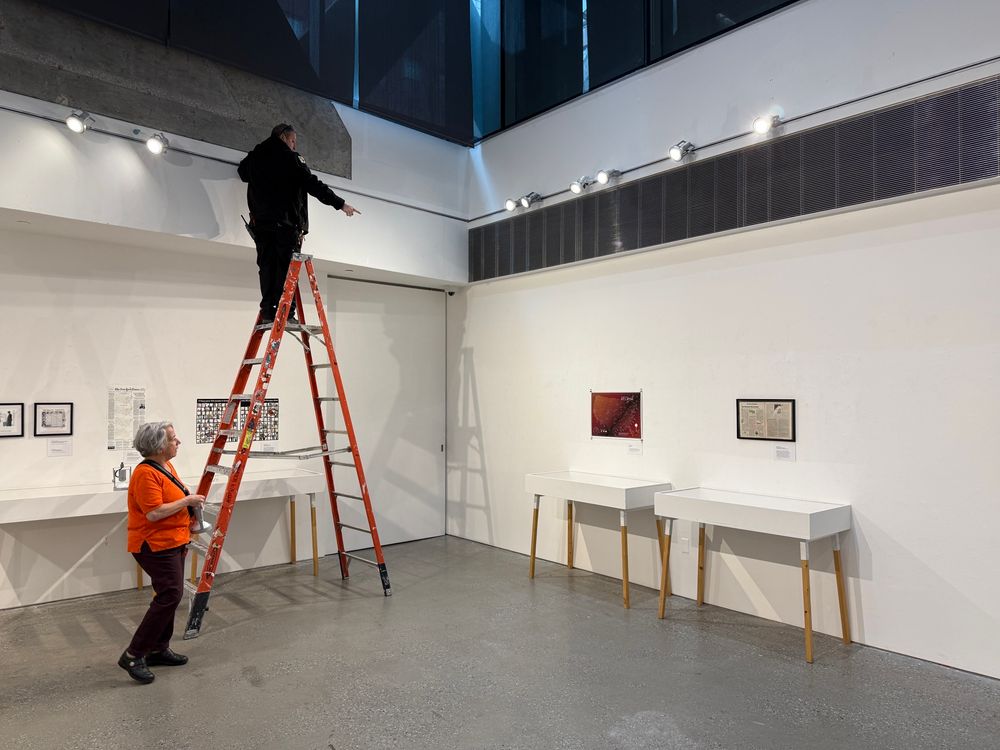
Setting spotlights on @kennethfield.bsky.social and @nigelblue.bsky.social
April 16, 2025 at 3:59 PM
Setting spotlights on @kennethfield.bsky.social and @nigelblue.bsky.social
Reposted by nigel holmes
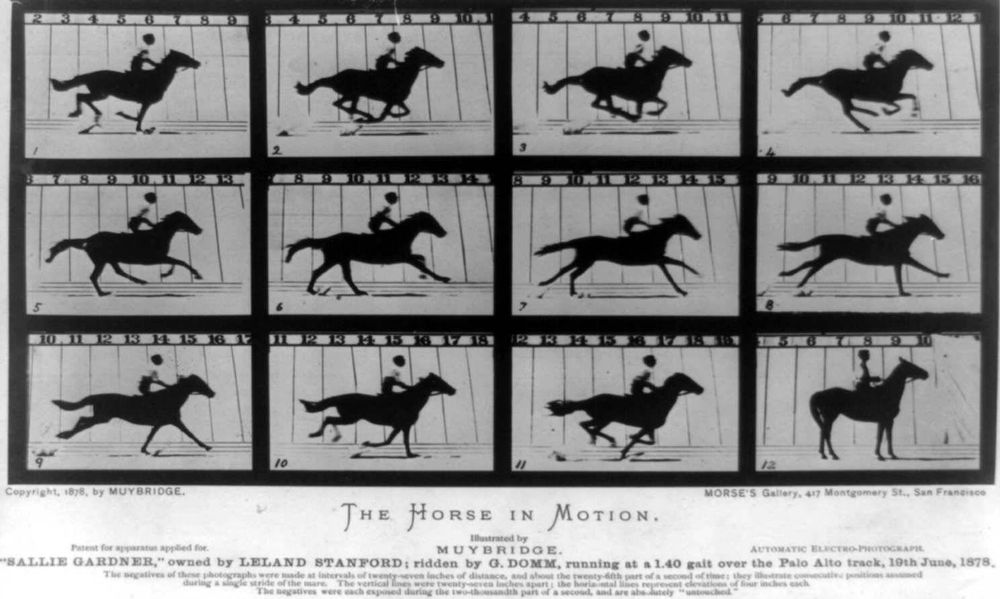
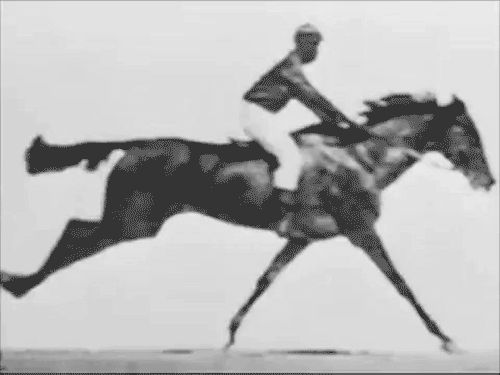
And here it is in motion. Can you spot where it is that the horse has all 4 feet off the ground? Leland Stanford made a bunch of money on this bet; Muybridge provided the proof.
April 9, 2025 at 1:12 AM
And here it is in motion. Can you spot where it is that the horse has all 4 feet off the ground? Leland Stanford made a bunch of money on this bet; Muybridge provided the proof.
Reposted by nigel holmes
#TodayinHistory #dataviz #Onthisday #OTD 📊
🎂Apr 9, 1830 Eadweard Muybridge born in Kingston upon Thames, England 🇬🇧
Muybridge pioneered the use of photography in the study of motion, a precursor of moving pictures & animated graphics.
🎂Apr 9, 1830 Eadweard Muybridge born in Kingston upon Thames, England 🇬🇧
Muybridge pioneered the use of photography in the study of motion, a precursor of moving pictures & animated graphics.
April 9, 2025 at 1:12 AM
#TodayinHistory #dataviz #Onthisday #OTD 📊
🎂Apr 9, 1830 Eadweard Muybridge born in Kingston upon Thames, England 🇬🇧
Muybridge pioneered the use of photography in the study of motion, a precursor of moving pictures & animated graphics.
🎂Apr 9, 1830 Eadweard Muybridge born in Kingston upon Thames, England 🇬🇧
Muybridge pioneered the use of photography in the study of motion, a precursor of moving pictures & animated graphics.
Reposted by nigel holmes
"charts have meaning that works for everyone"—Thank you Steven Heller! www.printmag.com/daily-heller...

The Daily Heller: Information Trumps Disinformation Every Time – PRINT Magazine
'Info We Trust, Remastered' tells tales of the evolution of charts throughout history.
www.printmag.com
April 8, 2025 at 1:46 PM
"charts have meaning that works for everyone"—Thank you Steven Heller! www.printmag.com/daily-heller...
Reposted by nigel holmes
today I'm making the welcome placard for next week's exhibition at Cooper Union, featuring an insane collection of AMAZING information designers: @nadiehbremer.com @jenchristiansen.com @datavandals.bsky.social @kennethfield.bsky.social @nigelblue.bsky.social @shirleywu.studio & many more

April 7, 2025 at 8:49 PM
today I'm making the welcome placard for next week's exhibition at Cooper Union, featuring an insane collection of AMAZING information designers: @nadiehbremer.com @jenchristiansen.com @datavandals.bsky.social @kennethfield.bsky.social @nigelblue.bsky.social @shirleywu.studio & many more
Reposted by nigel holmes

Background: in my last post, I speedwalked through millennia of science and history in the intersection of writing and art

Read The Signs
The Evolution of Writing, In Science and Art
open.substack.com
April 3, 2025 at 2:04 PM
Background: in my last post, I speedwalked through millennia of science and history in the intersection of writing and art
Reposted by nigel holmes

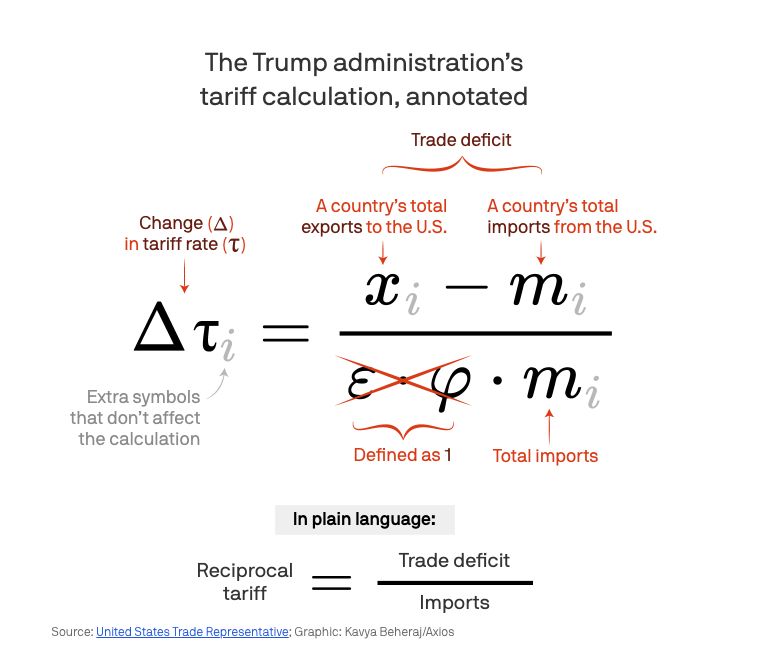
An incredible explainer on the "tariff formula" from @felixsalmon.com @axios.com
April 3, 2025 at 9:23 PM
An incredible explainer on the "tariff formula" from @felixsalmon.com @axios.com

Reposted by nigel holmes
new on Chartography www.chartography.net/p/previewing...
Previewing "The Craft of Data Graphics"
Pairing data-graphic masterpieces with rare works.
www.chartography.net
April 2, 2025 at 7:12 PM
new on Chartography www.chartography.net/p/previewing...
here’s the cover of my new book…out later in the year!
March 20, 2025 at 6:46 PM
here’s the cover of my new book…out later in the year!
Reposted by nigel holmes
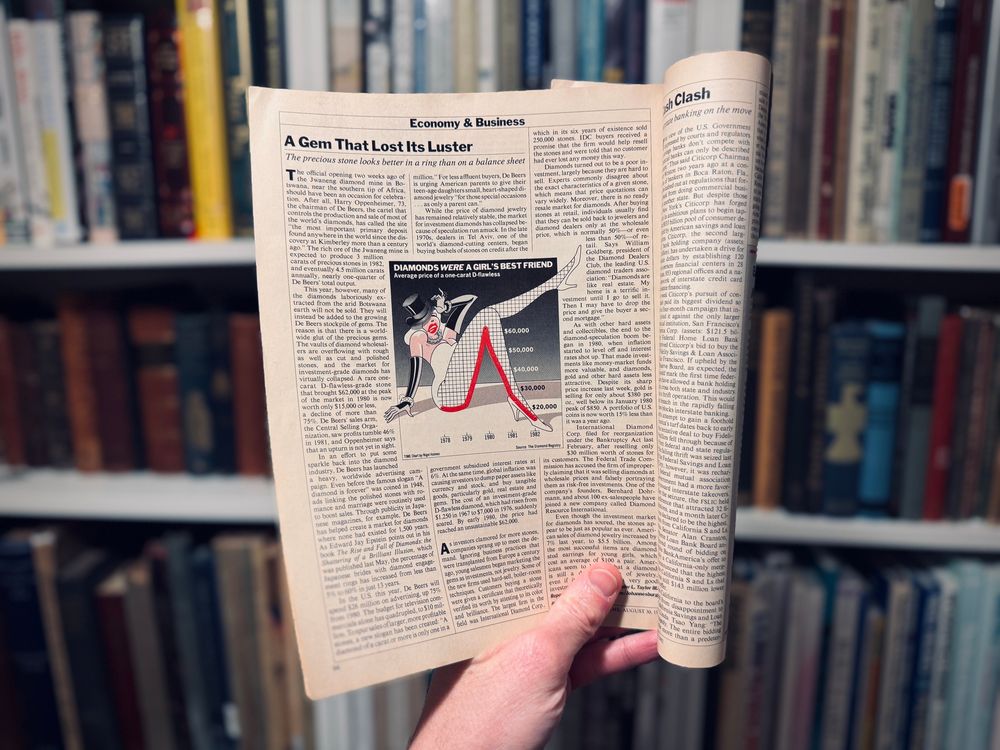
DIAMONDS WERE A GIRL’S BEST FRIEND—a classic 1982 TIME chart by @nigelblue.bsky.social—has arrived!
March 8, 2025 at 4:11 PM
DIAMONDS WERE A GIRL’S BEST FRIEND—a classic 1982 TIME chart by @nigelblue.bsky.social—has arrived!
Reposted by nigel holmes

Like everyone - the @datavandals.bsky.social abandoned Twitter and have a profile here! Give us a follow - we have tons of awesome news to share soon!

January 24, 2025 at 9:22 PM
Like everyone - the @datavandals.bsky.social abandoned Twitter and have a profile here! Give us a follow - we have tons of awesome news to share soon!
Reposted by nigel holmes
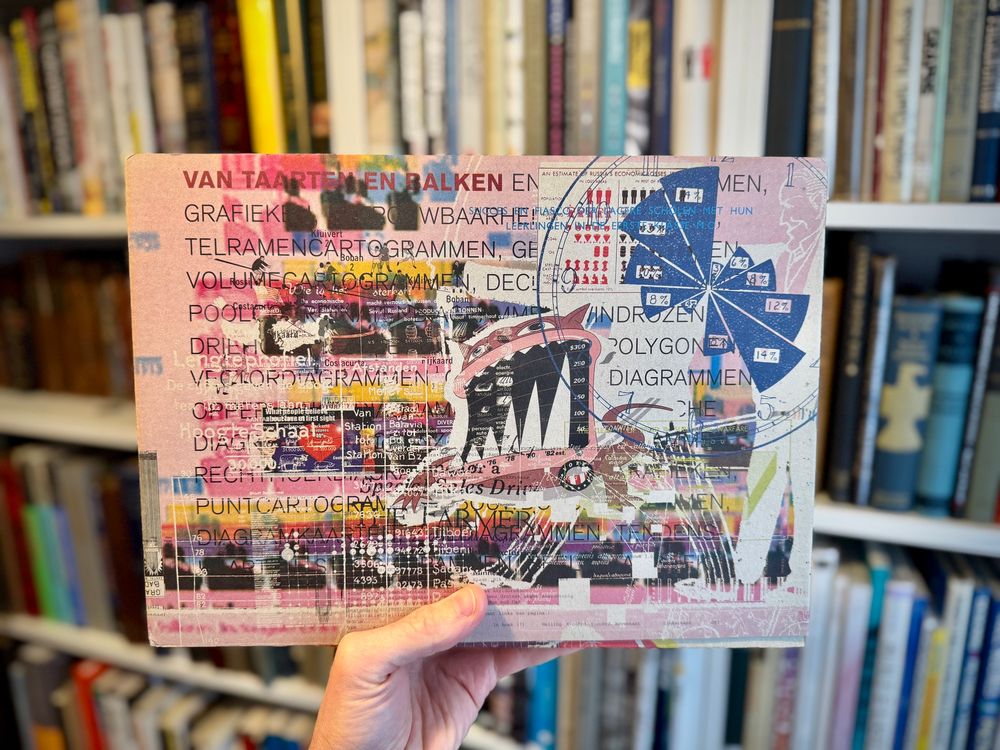
graphic magic just arrived via @nigelblue.bsky.social 💙
Van taarten en balken [Of pies and bars]. 1996 🇳🇱
Van taarten en balken [Of pies and bars]. 1996 🇳🇱
January 20, 2025 at 7:57 PM
graphic magic just arrived via @nigelblue.bsky.social 💙
Van taarten en balken [Of pies and bars]. 1996 🇳🇱
Van taarten en balken [Of pies and bars]. 1996 🇳🇱
Reposted by nigel holmes

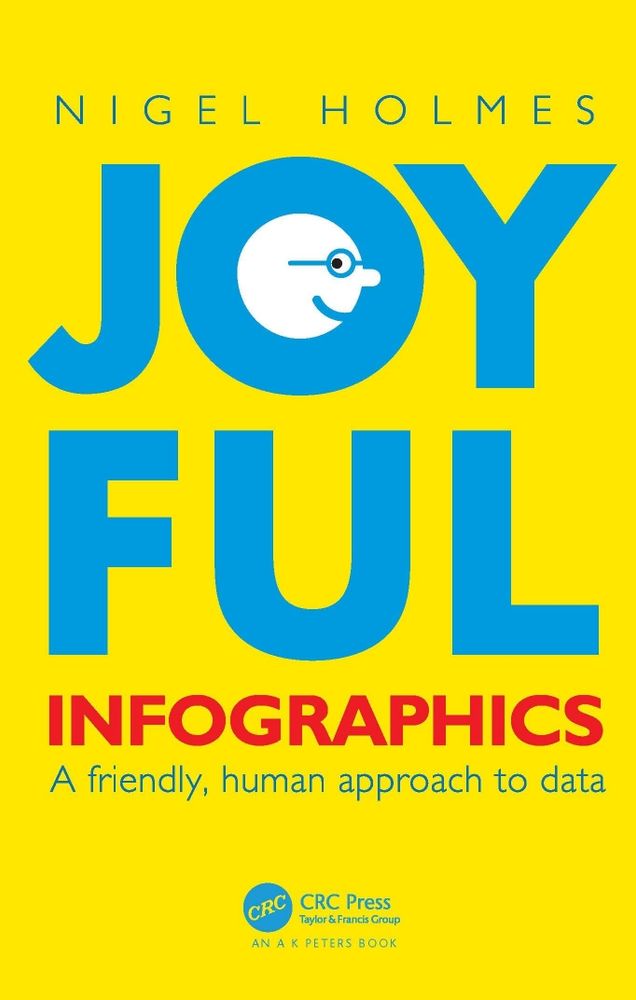
Have you read Nigel Holmes - Joyful infographics?
Imo a mustread when doing dataviz 🙌
@nigelblue.bsky.social
Imo a mustread when doing dataviz 🙌
@nigelblue.bsky.social
January 17, 2025 at 10:00 AM
Have you read Nigel Holmes - Joyful infographics?
Imo a mustread when doing dataviz 🙌
@nigelblue.bsky.social
Imo a mustread when doing dataviz 🙌
@nigelblue.bsky.social
Reposted by nigel holmes

Reposted by nigel holmes
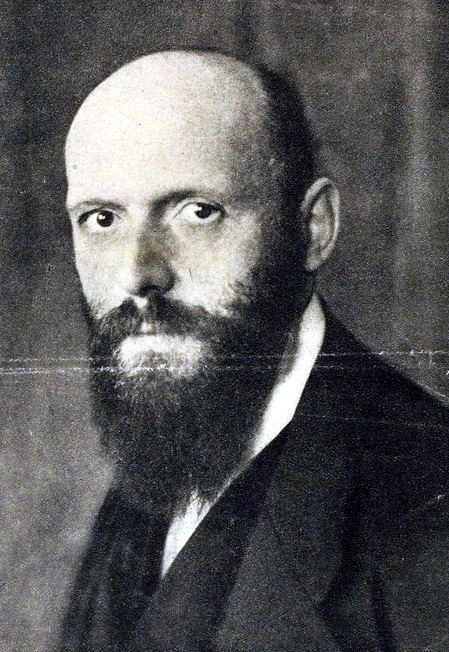
#TodayinHistory #dataviz #Onthisday #OTD 📊
💀Dec 22, 1945 Otto Neurath died in Oxford, England 🏴
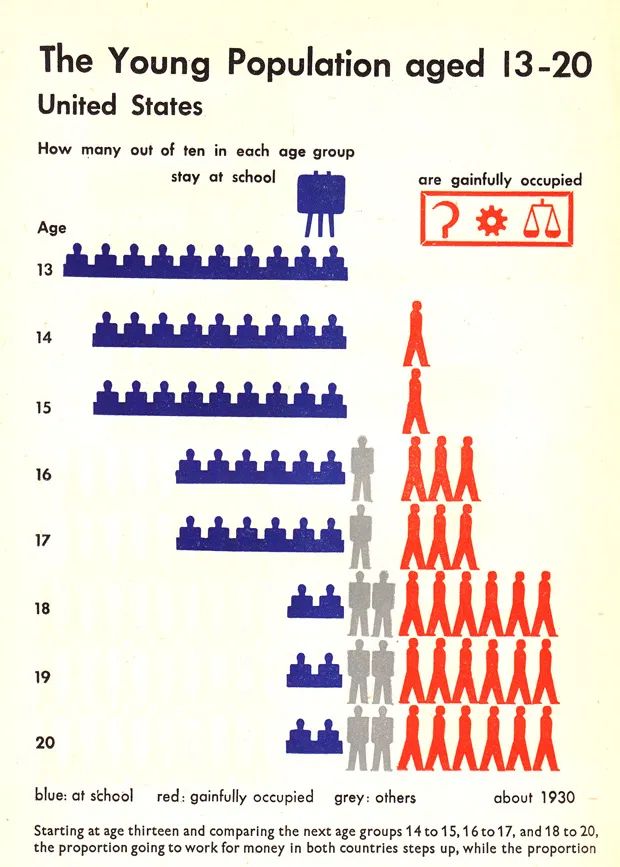
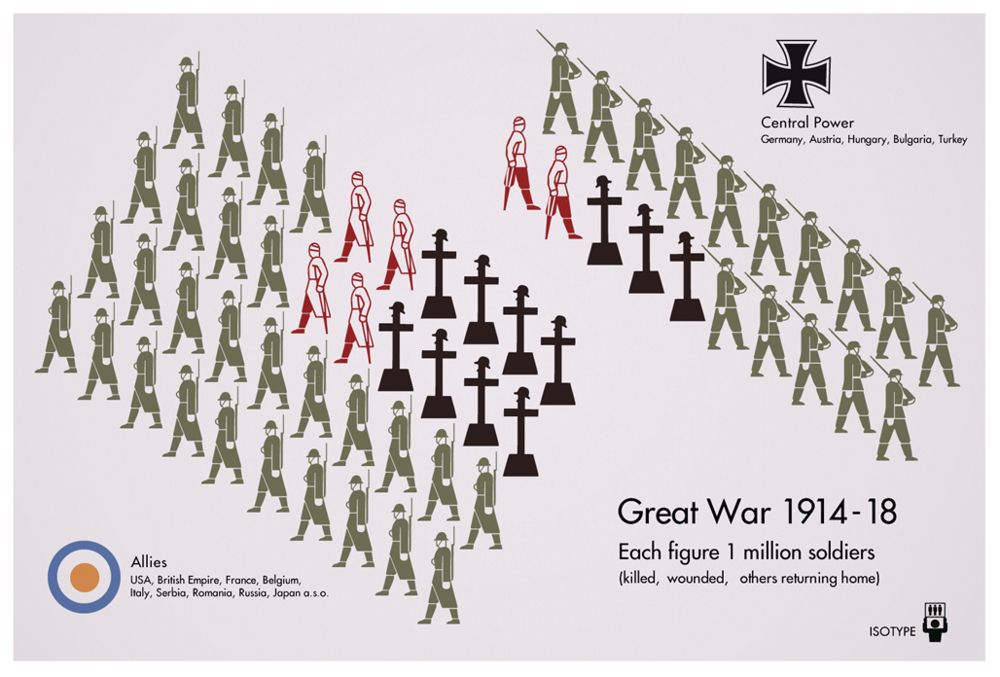
1924: Museum of Social Statistical Graphics and the ISOTYPE system, a method of showing social, technological, biological, and historical connections in pictorial form
💀Dec 22, 1945 Otto Neurath died in Oxford, England 🏴
1924: Museum of Social Statistical Graphics and the ISOTYPE system, a method of showing social, technological, biological, and historical connections in pictorial form
December 22, 2024 at 6:16 PM
#TodayinHistory #dataviz #Onthisday #OTD 📊
💀Dec 22, 1945 Otto Neurath died in Oxford, England 🏴
1924: Museum of Social Statistical Graphics and the ISOTYPE system, a method of showing social, technological, biological, and historical connections in pictorial form
💀Dec 22, 1945 Otto Neurath died in Oxford, England 🏴
1924: Museum of Social Statistical Graphics and the ISOTYPE system, a method of showing social, technological, biological, and historical connections in pictorial form
Reposted by nigel holmes
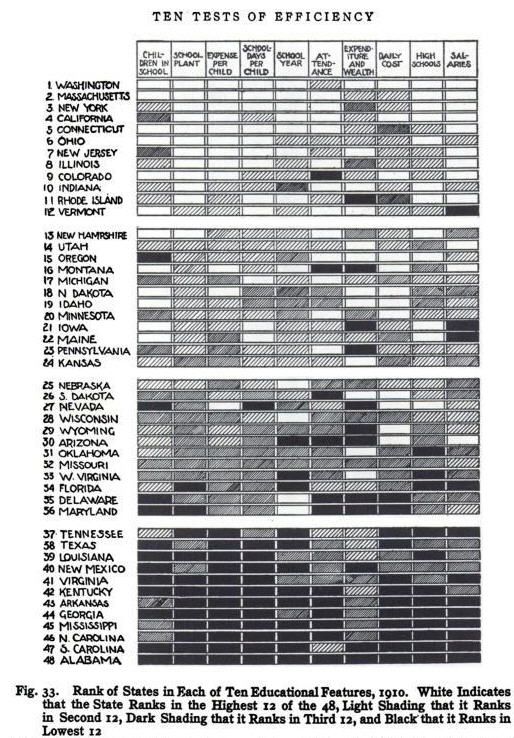
#TodayinHistory #dataviz #OTD 📊
🎂Dec 22, 1880 Willard Cope Brinton born in West Chester, PA, USA 🇺🇸
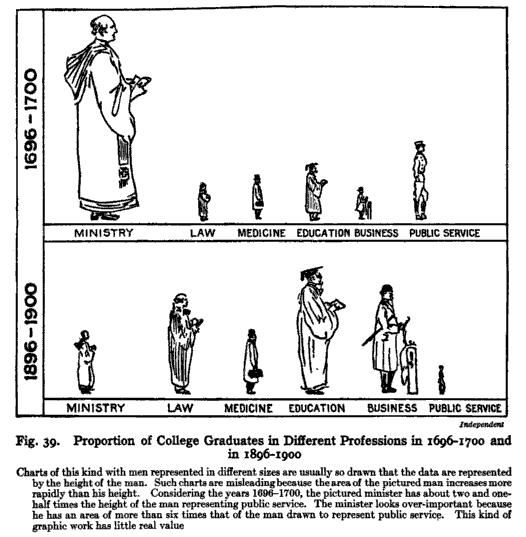
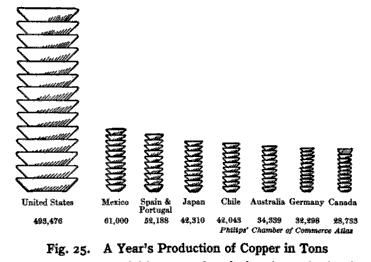
1914: Pictograms to represent a series of numbers by icons (combining concepts of the bar graph and pictogram of varying size) ; heat maps and more-- 'Graphic Methods for Presenting Facts'
🎂Dec 22, 1880 Willard Cope Brinton born in West Chester, PA, USA 🇺🇸
1914: Pictograms to represent a series of numbers by icons (combining concepts of the bar graph and pictogram of varying size) ; heat maps and more-- 'Graphic Methods for Presenting Facts'
December 22, 2024 at 1:57 AM
#TodayinHistory #dataviz #OTD 📊
🎂Dec 22, 1880 Willard Cope Brinton born in West Chester, PA, USA 🇺🇸
1914: Pictograms to represent a series of numbers by icons (combining concepts of the bar graph and pictogram of varying size) ; heat maps and more-- 'Graphic Methods for Presenting Facts'
🎂Dec 22, 1880 Willard Cope Brinton born in West Chester, PA, USA 🇺🇸
1914: Pictograms to represent a series of numbers by icons (combining concepts of the bar graph and pictogram of varying size) ; heat maps and more-- 'Graphic Methods for Presenting Facts'