


Dan O'Hara
@skeuomorphology.bsky.social
Runs the UK Covid PCR positivity map:
https://jamestindall.info/skeuomorphology/ladb_covid/index.html
Otherwise:
literary history | philosophy of tech | EXTREME METAPHORS: Interviews with JG Ballard http://amazon.co.uk/dp/B007QOXKHI | www.danohara.co.uk
https://jamestindall.info/skeuomorphology/ladb_covid/index.html
Otherwise:
literary history | philosophy of tech | EXTREME METAPHORS: Interviews with JG Ballard http://amazon.co.uk/dp/B007QOXKHI | www.danohara.co.uk
Pinned
Dan O'Hara
@skeuomorphology.bsky.social
· May 12

AI-Powered Coca-Cola Ad Celebrating Authors Gets Basic Facts Wrong
A new Coke ad proudly features a quote from a J.G. Ballard book, only he didn’t write the words and it’s not his book.
www.404media.co
I spoke to @emanuelmaiberg.bsky.social at @404media.bsky.social about Coca-Cola's new AI ad that can't tell the difference between me and J. G. Ballard
www.404media.co/ai-powered-c...
www.404media.co/ai-powered-c...
Reposted by Dan O'Hara
The PCR positivity map is out, and UKHSA is reporting another drop to 3.3% in England.
Taking into account all the areas that aren't reporting, we make that 4.38%.
That's more in line with 4.19% in Scotland (where there's much more reliable reporting).
jamestindall.info/skeuomorphol...
1/11
Taking into account all the areas that aren't reporting, we make that 4.38%.
That's more in line with 4.19% in Scotland (where there's much more reliable reporting).
jamestindall.info/skeuomorphol...
1/11

November 20, 2025 at 8:35 PM
The PCR positivity map is out, and UKHSA is reporting another drop to 3.3% in England.
Taking into account all the areas that aren't reporting, we make that 4.38%.
That's more in line with 4.19% in Scotland (where there's much more reliable reporting).
jamestindall.info/skeuomorphol...
1/11
Taking into account all the areas that aren't reporting, we make that 4.38%.
That's more in line with 4.19% in Scotland (where there's much more reliable reporting).
jamestindall.info/skeuomorphol...
1/11
I don't have much to say about the covid inquiry.
I'm looking back at my briefing documents advising local government on the 14th March 2020.
46 UK universities had already locked down by this date, ten days before Boris announced national lockdown.
I wish I'd pushed harder.
I'm looking back at my briefing documents advising local government on the 14th March 2020.
46 UK universities had already locked down by this date, ten days before Boris announced national lockdown.
I wish I'd pushed harder.

November 20, 2025 at 10:28 PM
I don't have much to say about the covid inquiry.
I'm looking back at my briefing documents advising local government on the 14th March 2020.
46 UK universities had already locked down by this date, ten days before Boris announced national lockdown.
I wish I'd pushed harder.
I'm looking back at my briefing documents advising local government on the 14th March 2020.
46 UK universities had already locked down by this date, ten days before Boris announced national lockdown.
I wish I'd pushed harder.
The PCR positivity map is out, and UKHSA is reporting another drop to 3.3% in England.
Taking into account all the areas that aren't reporting, we make that 4.38%.
That's more in line with 4.19% in Scotland (where there's much more reliable reporting).
jamestindall.info/skeuomorphol...
1/11
Taking into account all the areas that aren't reporting, we make that 4.38%.
That's more in line with 4.19% in Scotland (where there's much more reliable reporting).
jamestindall.info/skeuomorphol...
1/11
November 20, 2025 at 8:35 PM
The PCR positivity map is out, and UKHSA is reporting another drop to 3.3% in England.
Taking into account all the areas that aren't reporting, we make that 4.38%.
That's more in line with 4.19% in Scotland (where there's much more reliable reporting).
jamestindall.info/skeuomorphol...
1/11
Taking into account all the areas that aren't reporting, we make that 4.38%.
That's more in line with 4.19% in Scotland (where there's much more reliable reporting).
jamestindall.info/skeuomorphol...
1/11
Reposted by Dan O'Hara
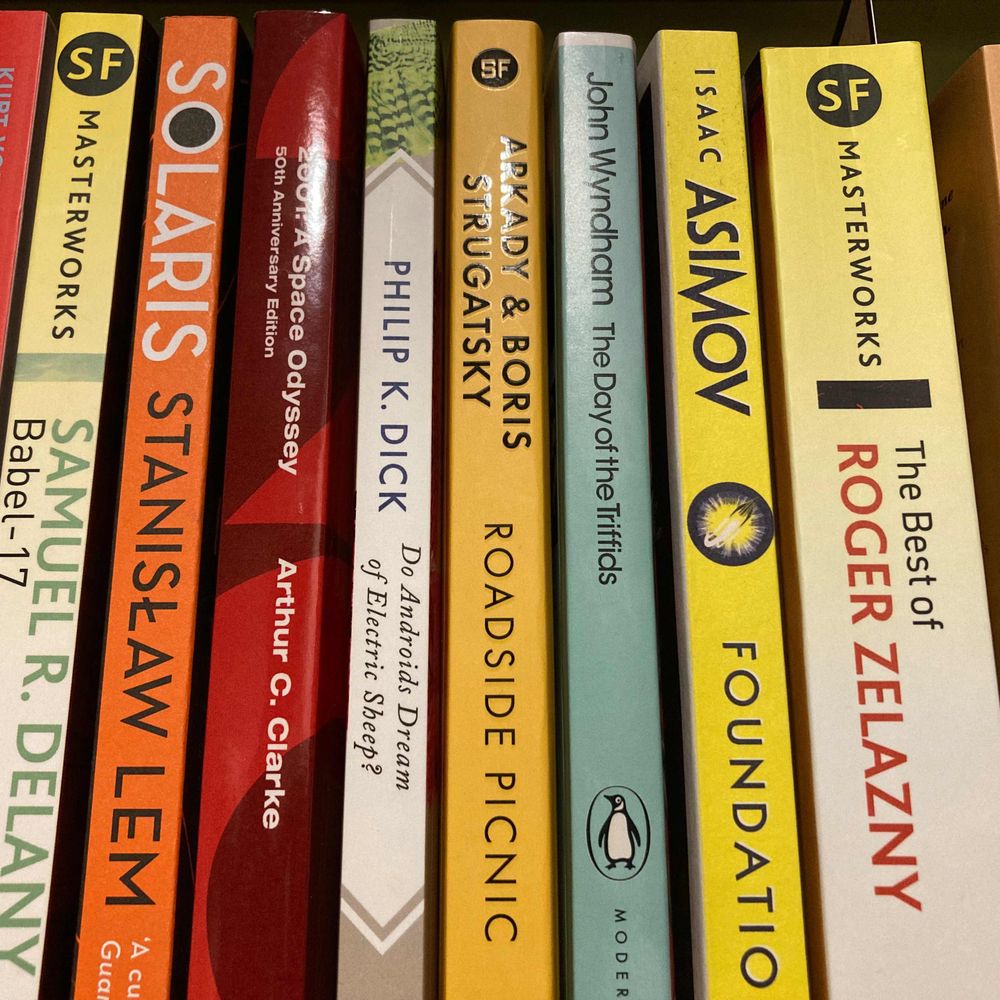
Remembering J.G. Ballard, born OTD 1930.
I’ve been reading his work for many years & I can readily appreciate why many qualify his writing as ‘timeless’.
And I can think of no better imagery to accompany this post than the equally timeless appeal of David Pelham’s superlative cover art 🙂
I’ve been reading his work for many years & I can readily appreciate why many qualify his writing as ‘timeless’.
And I can think of no better imagery to accompany this post than the equally timeless appeal of David Pelham’s superlative cover art 🙂

November 15, 2025 at 1:19 PM
Remembering J.G. Ballard, born OTD 1930.
I’ve been reading his work for many years & I can readily appreciate why many qualify his writing as ‘timeless’.
And I can think of no better imagery to accompany this post than the equally timeless appeal of David Pelham’s superlative cover art 🙂
I’ve been reading his work for many years & I can readily appreciate why many qualify his writing as ‘timeless’.
And I can think of no better imagery to accompany this post than the equally timeless appeal of David Pelham’s superlative cover art 🙂
Reposted by Dan O'Hara
The PCR positivity map is out, and national positivity across England has nudged downwards a little further to 5%. In Scotland it's 4.05%.
Adjusted for non-reporting areas, we make the English average 6.50%.
jamestindall.info/skeuomorphol...
1/7
Adjusted for non-reporting areas, we make the English average 6.50%.
jamestindall.info/skeuomorphol...
1/7

November 13, 2025 at 9:53 PM
The PCR positivity map is out, and national positivity across England has nudged downwards a little further to 5%. In Scotland it's 4.05%.
Adjusted for non-reporting areas, we make the English average 6.50%.
jamestindall.info/skeuomorphol...
1/7
Adjusted for non-reporting areas, we make the English average 6.50%.
jamestindall.info/skeuomorphol...
1/7
November 13, 2025 at 9:53 PM
The PCR positivity map is out, and national positivity across England has nudged downwards a little further to 5%. In Scotland it's 4.05%.
Adjusted for non-reporting areas, we make the English average 6.50%.
jamestindall.info/skeuomorphol...
1/7
Adjusted for non-reporting areas, we make the English average 6.50%.
jamestindall.info/skeuomorphol...
1/7
Reposted by Dan O'Hara

Excellent news that there's now a Covid positivity map for Scotland! A very useful tool to help predict incoming pressures on local NHS & Local Authority services, for CV people & anyone needing to manage risk. Thanks @skeuomorphology.bsky.social & @publichealthscot.bsky.social for supplying data 🙏
The PCR positivity map is out, and you might notice something a bit different this week.
From now onwards the map includes Scotland, using the same metric: PCR test positivity.
jamestindall.info/skeuomorphol...
1/10
From now onwards the map includes Scotland, using the same metric: PCR test positivity.
jamestindall.info/skeuomorphol...
1/10

November 7, 2025 at 3:14 PM
Excellent news that there's now a Covid positivity map for Scotland! A very useful tool to help predict incoming pressures on local NHS & Local Authority services, for CV people & anyone needing to manage risk. Thanks @skeuomorphology.bsky.social & @publichealthscot.bsky.social for supplying data 🙏
Reposted by Dan O'Hara
The PCR positivity map is out, and you might notice something a bit different this week.
From now onwards the map includes Scotland, using the same metric: PCR test positivity.
jamestindall.info/skeuomorphol...
1/10
From now onwards the map includes Scotland, using the same metric: PCR test positivity.
jamestindall.info/skeuomorphol...
1/10
November 6, 2025 at 7:27 PM
The PCR positivity map is out, and you might notice something a bit different this week.
From now onwards the map includes Scotland, using the same metric: PCR test positivity.
jamestindall.info/skeuomorphol...
1/10
From now onwards the map includes Scotland, using the same metric: PCR test positivity.
jamestindall.info/skeuomorphol...
1/10
November 6, 2025 at 7:27 PM
The PCR positivity map is out, and you might notice something a bit different this week.
From now onwards the map includes Scotland, using the same metric: PCR test positivity.
jamestindall.info/skeuomorphol...
1/10
From now onwards the map includes Scotland, using the same metric: PCR test positivity.
jamestindall.info/skeuomorphol...
1/10
Reposted by Dan O'Hara
The PCR positivity map is out, and there's been a more substantial drop in national positivity this week.
UKHSA report 8%.
Adjusted for non-reporting areas we make it 9.14%.
1/7
UKHSA report 8%.
Adjusted for non-reporting areas we make it 9.14%.
1/7

October 30, 2025 at 7:21 PM
The PCR positivity map is out, and there's been a more substantial drop in national positivity this week.
UKHSA report 8%.
Adjusted for non-reporting areas we make it 9.14%.
1/7
UKHSA report 8%.
Adjusted for non-reporting areas we make it 9.14%.
1/7
The PCR positivity map is out, and there's been a more substantial drop in national positivity this week.
UKHSA report 8%.
Adjusted for non-reporting areas we make it 9.14%.
1/7
UKHSA report 8%.
Adjusted for non-reporting areas we make it 9.14%.
1/7
October 30, 2025 at 7:21 PM
The PCR positivity map is out, and there's been a more substantial drop in national positivity this week.
UKHSA report 8%.
Adjusted for non-reporting areas we make it 9.14%.
1/7
UKHSA report 8%.
Adjusted for non-reporting areas we make it 9.14%.
1/7
Reposted by Dan O'Hara
The PCR positivity map is out, there's been another drop in positivity to 10.3%, and this week all surveillance indicators agree it's dropped.
Adjusting for non-reporting, we make the national average 11.96%.
jamestindall.info/skeuomorphol...
1/7
Adjusting for non-reporting, we make the national average 11.96%.
jamestindall.info/skeuomorphol...
1/7

October 23, 2025 at 6:14 PM
The PCR positivity map is out, there's been another drop in positivity to 10.3%, and this week all surveillance indicators agree it's dropped.
Adjusting for non-reporting, we make the national average 11.96%.
jamestindall.info/skeuomorphol...
1/7
Adjusting for non-reporting, we make the national average 11.96%.
jamestindall.info/skeuomorphol...
1/7
October 23, 2025 at 6:14 PM
The PCR positivity map is out, there's been another drop in positivity to 10.3%, and this week all surveillance indicators agree it's dropped.
Adjusting for non-reporting, we make the national average 11.96%.
jamestindall.info/skeuomorphol...
1/7
Adjusting for non-reporting, we make the national average 11.96%.
jamestindall.info/skeuomorphol...
1/7
Reposted by Dan O'Hara
The PCR positivity map is out, and levels have dipped slightly this week.
Although the number of areas not reporting has gone up this week, we adjust for that on the map's total, so we can be sure it's a real drop.
jamestindall.info/skeuomorphol...
1/10
Although the number of areas not reporting has gone up this week, we adjust for that on the map's total, so we can be sure it's a real drop.
jamestindall.info/skeuomorphol...
1/10

October 16, 2025 at 6:32 PM
The PCR positivity map is out, and levels have dipped slightly this week.
Although the number of areas not reporting has gone up this week, we adjust for that on the map's total, so we can be sure it's a real drop.
jamestindall.info/skeuomorphol...
1/10
Although the number of areas not reporting has gone up this week, we adjust for that on the map's total, so we can be sure it's a real drop.
jamestindall.info/skeuomorphol...
1/10
October 16, 2025 at 6:32 PM
The PCR positivity map is out, and levels have dipped slightly this week.
Although the number of areas not reporting has gone up this week, we adjust for that on the map's total, so we can be sure it's a real drop.
jamestindall.info/skeuomorphol...
1/10
Although the number of areas not reporting has gone up this week, we adjust for that on the map's total, so we can be sure it's a real drop.
jamestindall.info/skeuomorphol...
1/10
Reposted by Dan O'Hara
⚠️ Our Emergency Department (ED) remains under severe pressure.
If your condition is not life or limb threatening you will be facing a long wait or will be redirected to another urgent treatment service who can help you.
If your condition is not life or limb threatening you will be facing a long wait or will be redirected to another urgent treatment service who can help you.

October 10, 2025 at 1:19 PM
⚠️ Our Emergency Department (ED) remains under severe pressure.
If your condition is not life or limb threatening you will be facing a long wait or will be redirected to another urgent treatment service who can help you.
If your condition is not life or limb threatening you will be facing a long wait or will be redirected to another urgent treatment service who can help you.
Reposted by Dan O'Hara
The PCR positivity map is out, and UKHSA have finally deigned to describe covid activity as "medium".
UKHSA national positivity is 13.23%.
Adjusted for non-reporting we make it 15.27%.
jamestindall.info/skeuomorphol...
1/
UKHSA national positivity is 13.23%.
Adjusted for non-reporting we make it 15.27%.
jamestindall.info/skeuomorphol...
1/

October 9, 2025 at 6:23 PM
The PCR positivity map is out, and UKHSA have finally deigned to describe covid activity as "medium".
UKHSA national positivity is 13.23%.
Adjusted for non-reporting we make it 15.27%.
jamestindall.info/skeuomorphol...
1/
UKHSA national positivity is 13.23%.
Adjusted for non-reporting we make it 15.27%.
jamestindall.info/skeuomorphol...
1/
October 9, 2025 at 6:23 PM
The PCR positivity map is out, and UKHSA have finally deigned to describe covid activity as "medium".
UKHSA national positivity is 13.23%.
Adjusted for non-reporting we make it 15.27%.
jamestindall.info/skeuomorphol...
1/
UKHSA national positivity is 13.23%.
Adjusted for non-reporting we make it 15.27%.
jamestindall.info/skeuomorphol...
1/
Shrewbury & Telford NHS Trust reintroducing masks as of today.

October 8, 2025 at 7:32 AM
Shrewbury & Telford NHS Trust reintroducing masks as of today.
NOIDs data up to yesterday.
It's the most current data we get, good for indicating the trend but poor for tracking levels.
When Thursday's map comes out, levels will certainly be higher than last autumn's wave.
Feels like the limited NHS vaccines are starting a bit late.
It's the most current data we get, good for indicating the trend but poor for tracking levels.
When Thursday's map comes out, levels will certainly be higher than last autumn's wave.
Feels like the limited NHS vaccines are starting a bit late.

October 6, 2025 at 7:49 PM
NOIDs data up to yesterday.
It's the most current data we get, good for indicating the trend but poor for tracking levels.
When Thursday's map comes out, levels will certainly be higher than last autumn's wave.
Feels like the limited NHS vaccines are starting a bit late.
It's the most current data we get, good for indicating the trend but poor for tracking levels.
When Thursday's map comes out, levels will certainly be higher than last autumn's wave.
Feels like the limited NHS vaccines are starting a bit late.
Reposted by Dan O'Hara
The PCR positivity map is out, and it's evident that everywhere is seeing a significant surge.
UKHSA positivity has risen to 11.83%.
Adjusted for non-reporting areas, we make that 13.77%.
jamestindall.info/skeuomorphol...
1/8
UKHSA positivity has risen to 11.83%.
Adjusted for non-reporting areas, we make that 13.77%.
jamestindall.info/skeuomorphol...
1/8

October 2, 2025 at 6:55 PM
The PCR positivity map is out, and it's evident that everywhere is seeing a significant surge.
UKHSA positivity has risen to 11.83%.
Adjusted for non-reporting areas, we make that 13.77%.
jamestindall.info/skeuomorphol...
1/8
UKHSA positivity has risen to 11.83%.
Adjusted for non-reporting areas, we make that 13.77%.
jamestindall.info/skeuomorphol...
1/8
Reposted by Dan O'Hara

If you're not eligible on the NHS (and most of us aren't 🙄), private autumn COVID vaccinations are now available in the UK, if you can find a pharmacy that stocks it, and can afford it 🙄
I was able to get the Comirnaty LP.8.1 (Pfizer/BioNTech) vaccine today.
pharmadoctor.co.uk/patient/serv...
I was able to get the Comirnaty LP.8.1 (Pfizer/BioNTech) vaccine today.
pharmadoctor.co.uk/patient/serv...

Pharmadoctor, providing clinical services at your local pharmacy
The UK's leading provider of private pharmacy based clinical services. Clinical services include all vaccinations (travel health and seasonal vaccines), as well as minor ailment and test 'n' treat ser...
pharmadoctor.co.uk
October 2, 2025 at 8:22 PM
The PCR positivity map is out, and it's evident that everywhere is seeing a significant surge.
UKHSA positivity has risen to 11.83%.
Adjusted for non-reporting areas, we make that 13.77%.
jamestindall.info/skeuomorphol...
1/8
UKHSA positivity has risen to 11.83%.
Adjusted for non-reporting areas, we make that 13.77%.
jamestindall.info/skeuomorphol...
1/8
October 2, 2025 at 6:55 PM
The PCR positivity map is out, and it's evident that everywhere is seeing a significant surge.
UKHSA positivity has risen to 11.83%.
Adjusted for non-reporting areas, we make that 13.77%.
jamestindall.info/skeuomorphol...
1/8
UKHSA positivity has risen to 11.83%.
Adjusted for non-reporting areas, we make that 13.77%.
jamestindall.info/skeuomorphol...
1/8
A surprise to see a relatively factual, sober article about covid on the front page of the BBC
Good to see it addresses rapid reinfections
A brief 🧵
1/3
www.bbc.co.uk/news/article...
Good to see it addresses rapid reinfections
A brief 🧵
1/3
www.bbc.co.uk/news/article...

Covid cases rising with new variants 'Nimbus' and 'Stratus'
Unwell with a bad throat and temperature? You may have one of the new Covid strains circulating this autumn.
www.bbc.co.uk
September 30, 2025 at 6:21 PM
A surprise to see a relatively factual, sober article about covid on the front page of the BBC
Good to see it addresses rapid reinfections
A brief 🧵
1/3
www.bbc.co.uk/news/article...
Good to see it addresses rapid reinfections
A brief 🧵
1/3
www.bbc.co.uk/news/article...
Reposted by Dan O'Hara

Wie verteilen sich Infektionen in Deutschland? Wo treten Hotspots auf? Schlägt die #Wiesn Wellen? Antworten gibt die neue Landkreis-Karte!
covidisnotover.info/aktuelle-cor...
#CovidIsNotOver #SarsCoV2 #Covid #Corona #LongCovid
covidisnotover.info/aktuelle-cor...
#CovidIsNotOver #SarsCoV2 #Covid #Corona #LongCovid
September 27, 2025 at 1:00 PM
Wie verteilen sich Infektionen in Deutschland? Wo treten Hotspots auf? Schlägt die #Wiesn Wellen? Antworten gibt die neue Landkreis-Karte!
covidisnotover.info/aktuelle-cor...
#CovidIsNotOver #SarsCoV2 #Covid #Corona #LongCovid
covidisnotover.info/aktuelle-cor...
#CovidIsNotOver #SarsCoV2 #Covid #Corona #LongCovid