Alex Kalinin
@alxndrkalinin.bsky.social
250 followers 250 following 25 posts
AI/ML for image-based profiling @broadinstitute.org | prev CUHK-SZ & UMich
Posts Media Videos Starter Packs
Pinned
alxndrkalinin.bsky.social
🔬🤖 Introducing Spotlight: virtual staining (VS) improved by focusing on cells

VS models often learn to predict both cells and noisy background, because training treats all pixels equally. We address this by explicitly training models to prioritize foreground.

1/5
Figure 1:A schematic overview of Spotlight. a: Typical virtual staining models are trained using a pixel-wise loss such as mean squared error (MSE) on the whole image. b: Spotlight uses foreground estimation obtained by histogram thresholding to restrict pixel-wise loss to foreground areas and also employs soft-thresholding of the prediction to compute segmentation loss.
Reposted by Alex Kalinin
niranjchandrasekaran.com
Morph Map is now published in Nature Methods. Excited to see what the community discovers with this resource mapping ~15,000 human genes!

rdcu.be/ezGre
alxndrkalinin.bsky.social
In applications, there are going to be some fun CV presentations in the GenBio workshop - come check it out!

Disclaimer: I have one of those and would love deeper critique from a CV standpoint:
bsky.app/profile/alxn...
alxndrkalinin.bsky.social
🔬🤖 Introducing Spotlight: virtual staining (VS) improved by focusing on cells

VS models often learn to predict both cells and noisy background, because training treats all pixels equally. We address this by explicitly training models to prioritize foreground.

1/5
Figure 1:A schematic overview of Spotlight. a: Typical virtual staining models are trained using a pixel-wise loss such as mean squared error (MSE) on the whole image. b: Spotlight uses foreground estimation obtained by histogram thresholding to restrict pixel-wise loss to foreground areas and also employs soft-thresholding of the prediction to compute segmentation loss.
alxndrkalinin.bsky.social
The visual difference is clear: compared to a baseline (F-net), Spotlight sharply reduces artifacts, resulting in clearer nuclear boundaries and less segmentation artifacts, while preserving foreground textures.

4/5
alxndrkalinin.bsky.social
💡Spotlight uses the fact that even simple histogram thresholding (e.g., Otsu) is often sufficient to approximate informative FG regions. We use this to (1) mask MSE loss to focus learning on FG intensities, and (2) add a FG/BG segmentation loss to preserve cell morphology.

3/5
alxndrkalinin.bsky.social
Most VS models are trained with pixel-wise losses like MSE, treating background (BG) and foreground (FG) equally. Unlike natural images, BG in cell imaging isn't informative–so models learn to reproduce noise. E.g., in 3D, predictions show axial blur and elongation.

2/5
alxndrkalinin.bsky.social
🔬🤖 Introducing Spotlight: virtual staining (VS) improved by focusing on cells

VS models often learn to predict both cells and noisy background, because training treats all pixels equally. We address this by explicitly training models to prioritize foreground.

1/5
Figure 1:A schematic overview of Spotlight. a: Typical virtual staining models are trained using a pixel-wise loss such as mean squared error (MSE) on the whole image. b: Spotlight uses foreground estimation obtained by histogram thresholding to restrict pixel-wise loss to foreground areas and also employs soft-thresholding of the prediction to compute segmentation loss.
alxndrkalinin.bsky.social
Looks neat! How does the number/variety of features compare to Cellprofiler? Does it have Python bindings?
alxndrkalinin.bsky.social
Key benefits:
- Reproducibility: replaces GUI workflows with code
- General: agnostic to data types (3D images, spatial transcriptomics)
- Few dependencies: easy to integrate into existing image analysis frameworks
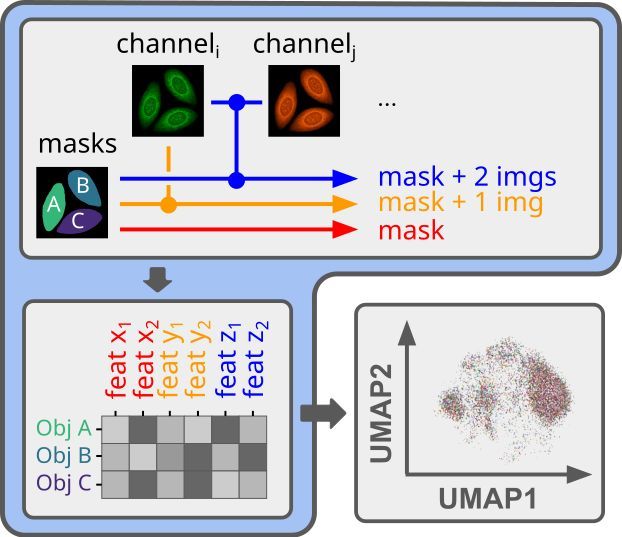
- Backwards-support: largely matches CellProfiler features

4/6
alxndrkalinin.bsky.social
With that in mind, we developed cp_measure, a Python library that extracts morphological features from segmented images from within your pipeline, bridging the gap between the BioAI/ML community and the existing GUI-based tool that populates bioimaging workflows.

3/6
alxndrkalinin.bsky.social
We felt there were a limited number of programmatic tools for featurizing segmented cell images, and CellProfiler is the de-facto standard for interpretable features.

2/6
alxndrkalinin.bsky.social
🔬API-first feature extraction for image-based profiling workflows

If you need to obtain interpretable features from your segmented microscopy images, but want to do it in a fully automated way, we know the struggle.

1/6
Reposted by Alex Kalinin
drannecarpenter.bsky.social
If you’re interested in single cell data analysis, come give Image based profiles a try! Huge dataset being made available for exploration at this hackathon (+ symposium):

Berlin, November cytodata25.eu-openscreen.eu
Reposted by Alex Kalinin
ai4life.bsky.social
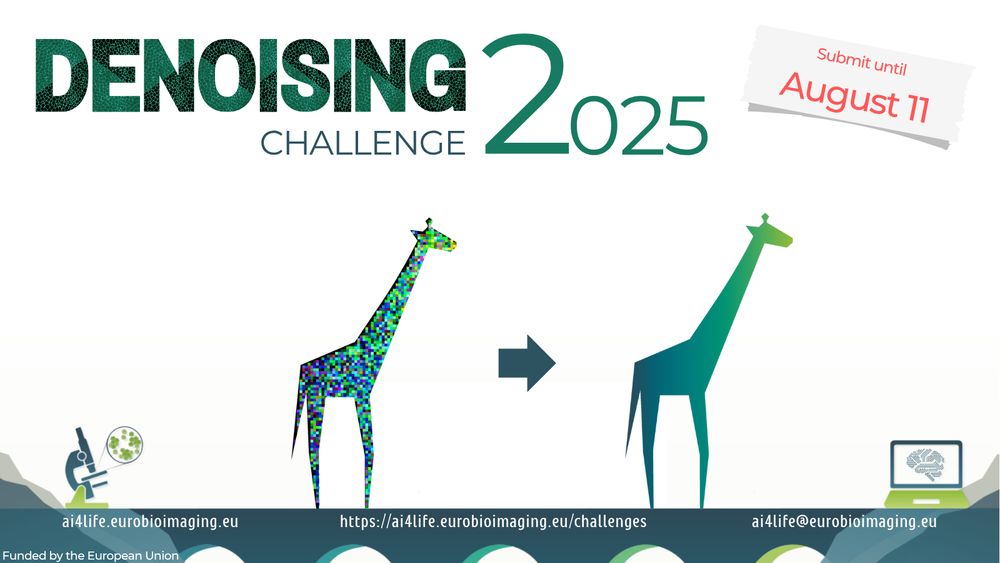
The 2nd AI4Life Challenge is live!
Calling the AI & bioimaging community to tackle a key microscopy challenge: removing noise while preserving detail.

📦 Paired noisy/clean datasets
📈 Ground-truth evaluation
🧠 DL focus

Build, test, compete 👉 ai4life.eurobioimaging.eu/challenge-2/
alxndrkalinin.bsky.social
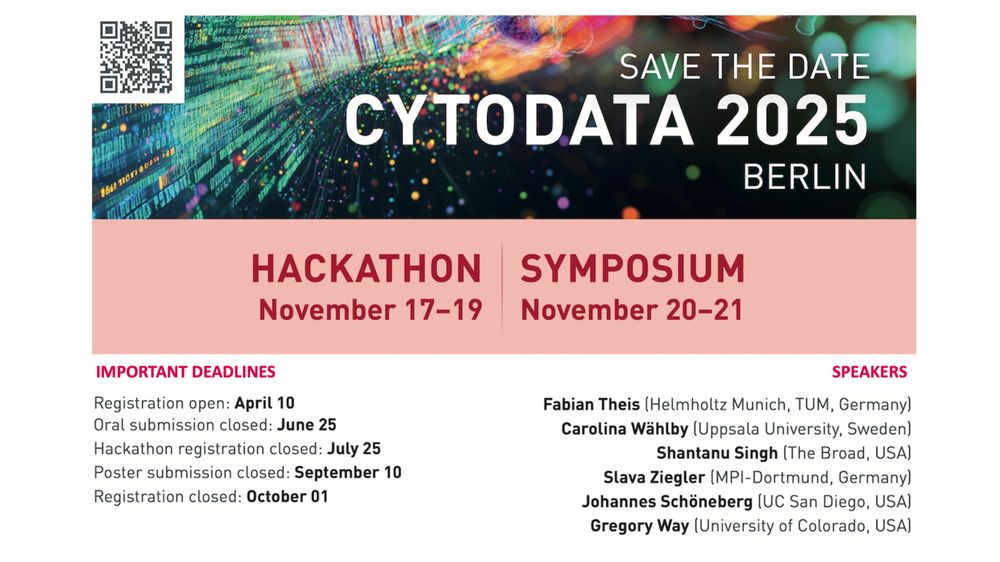
There is still time to submit an abstract to CytoData 2025!
cytodata.bsky.social
🌟 𝗥𝗲𝗺𝗶𝗻𝗱𝗲𝗿 🌟
The deadline for abstract submissions for oral presentations at Cytodata 2025 in Berlin is approaching!

👉 𝗦𝘂𝗯𝗺𝗶𝘁 𝘆𝗼𝘂𝗿 𝗮𝗯𝘀𝘁𝗿𝗮𝗰𝘁 𝗯𝘆 𝗝𝘂𝗻𝗲 25!
cytodata25.eu-openscreen.eu/registration/

#BerlinConference #Imageanalysis #Microscopy
Reposted by Alex Kalinin
alex-krull.bsky.social
The submission for 2025's BioImage Computing @iccv.bsky.social is now open. If things go like the last years, I am looking forward to all you brilliant submissions.
www.bioimagecomputing.com
BioImage Computing
a truly interdisciplinary workshop
www.bioimagecomputing.com
alxndrkalinin.bsky.social
Huge thanks to the whole team for making this work possible! 👏 @johnarevalo.bsky.social, Erik Serrano, @lvulliard.bsky.social,‬ Hillary Tsang, Michael Bornholdt, Alán Muñoz, @sugansivaguru.bsky.social, Bartek Rajwa, @drannecarpenter.bsky.social, Gregory P. Way, @shantanu-singh.cc
7/7
alxndrkalinin.bsky.social
mAP performs well across diverse data types (imaging, proteomics, transcriptomics), perturbation types (gene edits, small molecules), and resolutions (bulk, single-cell). Our fast, open-source Python package copairs makes application easy and scalable:
github.com/cytomining/c...
6/7
GitHub - cytomining/copairs: Find profile pairs and compute metrics between them.
Find profile pairs and compute metrics between them. - cytomining/copairs
github.com
alxndrkalinin.bsky.social
Our method is non-parametric and robust: similarities are converted into ranks, with statistical significance determined by permutation testing. No need for assumptions about distribution, linearity, or sample size—just choose a sensible distance measure for your data! 🚀
5/7
alxndrkalinin.bsky.social
Similarly, mAP can quantify phenotypic consistency *within* groups—like compounds with the same mechanism or genes with similar function—by checking how highly related perturbations within the group rank when retrieved against others.
4/7
alxndrkalinin.bsky.social
We approach this as an information retrieval problem: replicates of a phenotypically active perturbation should rank higher in similarity when retrieved against control replicates. We quantify this with a single, data-driven metric—mean average precision (mAP).
3/7
Schematic overview of the mAP framework for profiling data analysis. (A) Shows multiple replicate profiles per perturbation and controls. (B) Selects one replicate as a query and measures distances to other replicates and controls. (C) Profiles ranked by decreasing similarity, converted into binary labels for precision and recall calculation at each rank. (D) Average precision calculated by averaging precision at ranks containing perturbation replicates, shown graphically as an area under a precision-recall curve. (E) Average precision scores for all replicates averaged into a single mean average precision (mAP) score per perturbation. (F) The approach is also extended to retrieve groups of perturbations sharing biological annotations, such as mechanism of action (MoA).