Tom Smith
@analyst42.bsky.social
290 followers
810 following
84 posts
Code-first data analyst, mostly #rstats. Good information --> good decisions. Head of Activity Analysis & Forecasting at Nottingham University Hospitals NHS Trust. Personal account, views my own. https://github.com/ThomUK
Posts
Media
Videos
Starter Packs
Reposted by Tom Smith


Tom Smith
@analyst42.bsky.social
· Jun 25
Tom Smith
@analyst42.bsky.social
· Jun 25
Tom Smith
@analyst42.bsky.social
· Jun 25

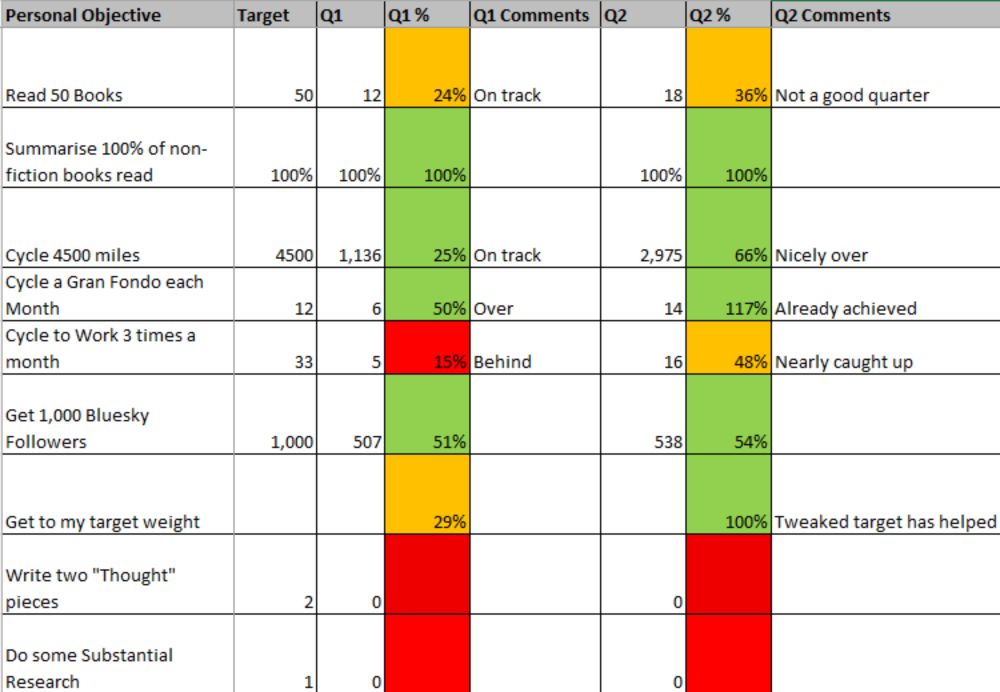
Tom Smith
@analyst42.bsky.social
· Jun 7

Tom Loosemore
@tomski.com
· Jun 7

On the ground with hope and grit: what the centre can learn from the frontline | Capacity
What if the real breakthroughs in public service innovation aren’t happening in Whitehall, but in Wirral, Sefton and communities across the Liverpool City R ...
thisiscapacity.co.uk


Tom Smith
@analyst42.bsky.social
· May 30


Reposted by Tom Smith


Reposted by Tom Smith


Reposted by Tom Smith


Tom Smith
@analyst42.bsky.social
· May 14
Reposted by Tom Smith

Reposted by Tom Smith


Reposted by Tom Smith

Reposted by Tom Smith


Reposted by Tom Smith


Reposted by Tom Smith


