Andrew Bell
@andrewjdbell.bsky.social
1.1K followers 270 following 3 posts
Senior Lecturer in Quantitative Social Sciences, University of Sheffield. Multilevel models, age period cohort, Intersectionality, etc https://linktr.ee/andrewjdbell
Posts Media Videos Starter Packs
Reposted by Andrew Bell
dingdingpeng.the100.ci
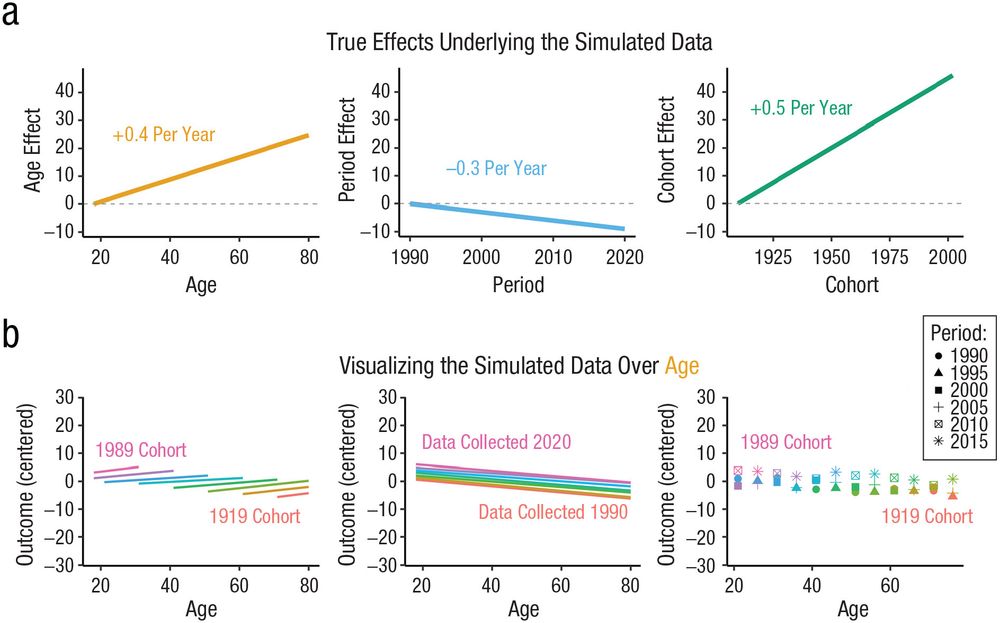
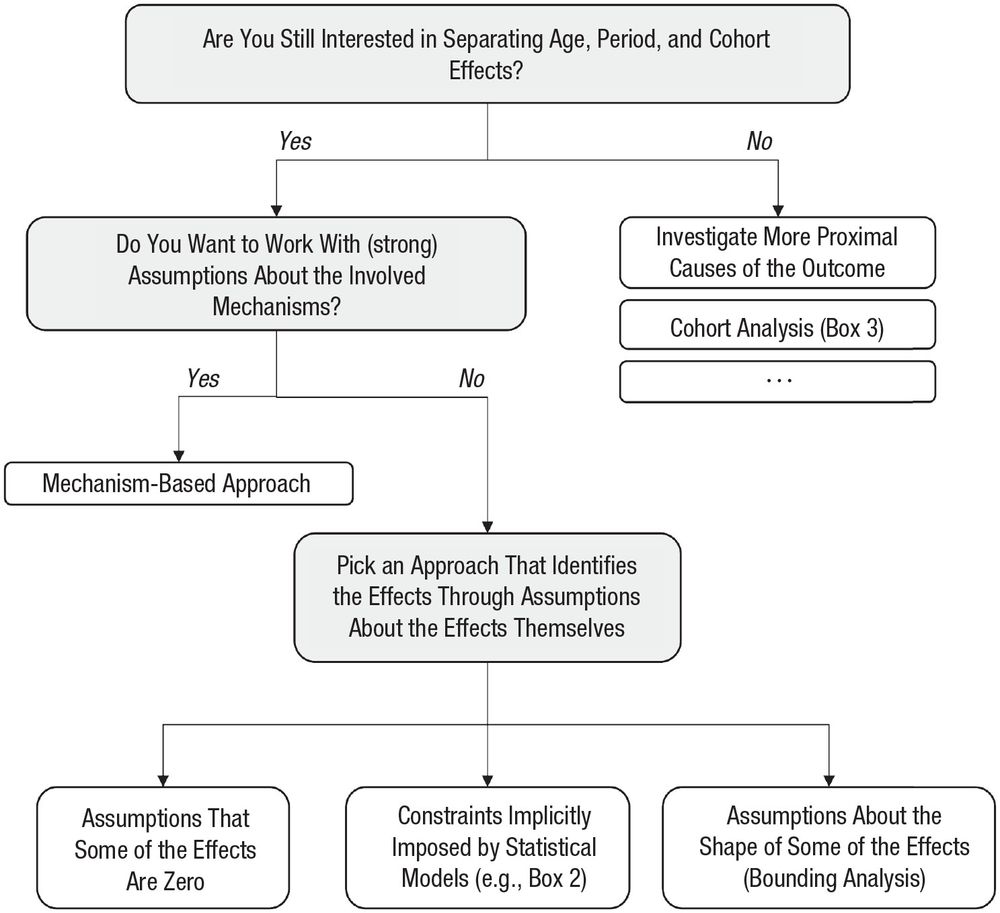
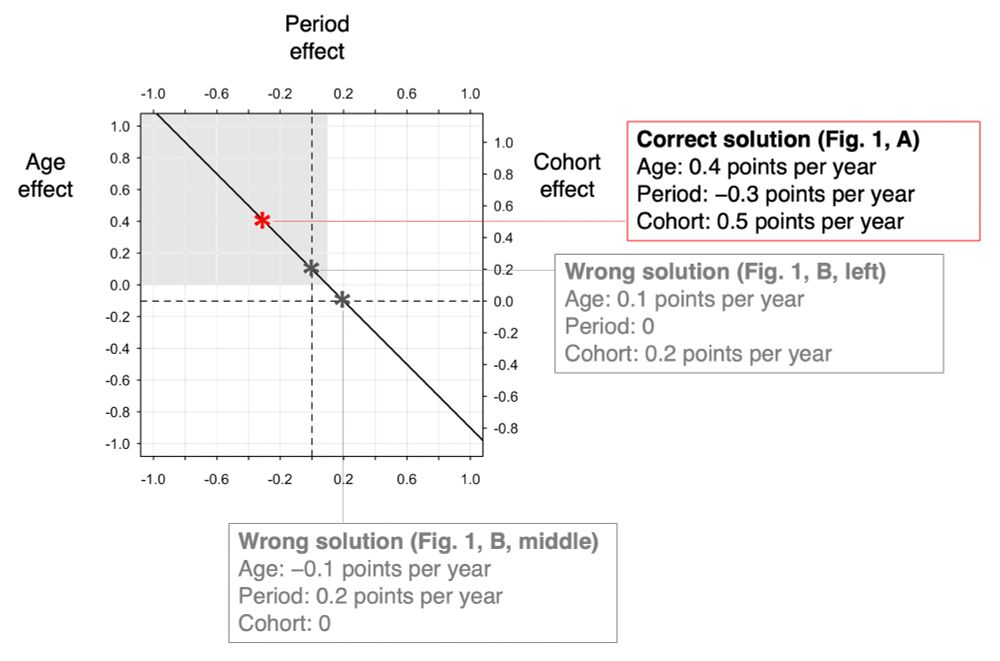
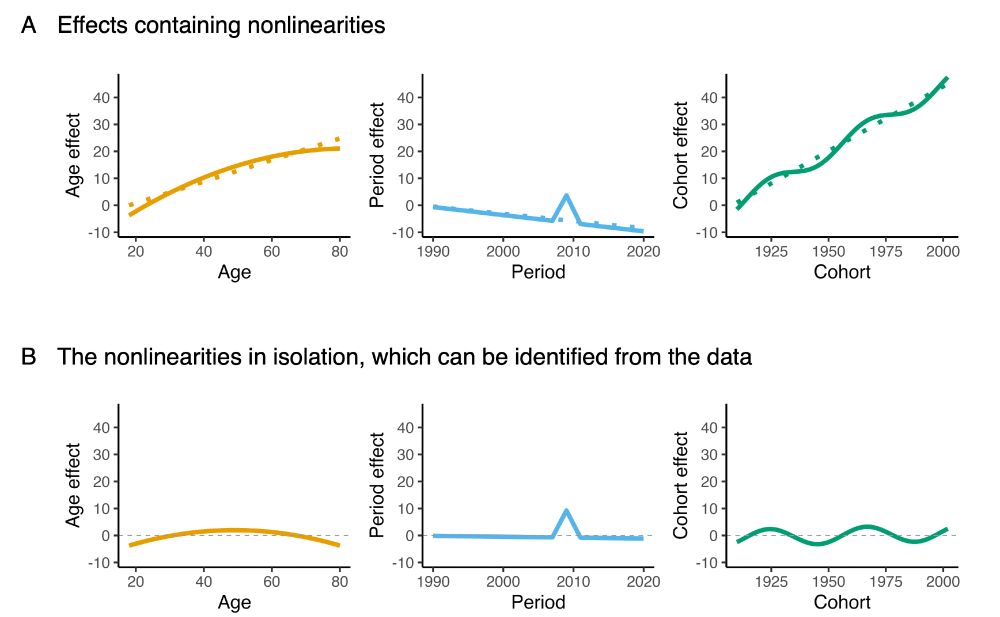
Now officially out with nice formatting and all 🥳 "Thinking clearly about age, period, and cohort effects" -- a gentle introduction to the age-period-cohort problem and how to "solve" it through various types of assumptions.

journals.sagepub.com/doi/10.1177/...
Reposted by Andrew Bell
ncrm.ac.uk
NCRM has opened applications to participate in the Research Methods Rendezvous!

This free event will explore the process of turning early-stage ideas into #research projects.

#RMR2025 takes place online on 10 September and 29 October 2025.

Apply: www.ncrm.ac.uk/training/RMR...
A promotional graphic for the Research Methods Rendezvous, which takes place online on 10 September and 29 October 2025.
Reposted by Andrew Bell
dingdingpeng.the100.ci
Thanks to everybody who chimed in!

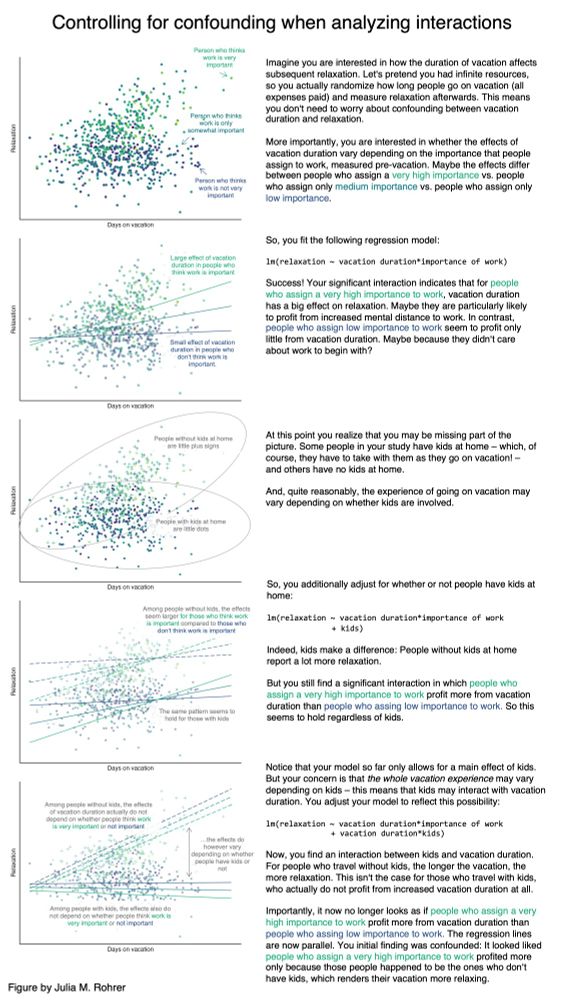
I arrived at the conclusion that (1) there's a lot of interesting stuff about interactions and (2) the figure I was looking for does not exist.

So, I made it myself! Here's a simple illustration of how to control for confounding in interactions:>
Reposted by Andrew Bell
healthequitynorth.bsky.social
Our research on the effects that PIP changes could have on local economies, written by authors @nataliecbennett.bsky.social @profbambra.bsky.social & @lukemunford.bsky.social, was featured on the @itvpeston.bsky.social programme last night - you can watch the episode on catch up
itvpeston.bsky.social
Join ITV’s Flagship Politics show

Tonight Robert Peston and Anushka Asthana will be joined by:

🌹 Gordon Brown
🇪🇺 Pedro Serrano
💼 Sir Charlie Mayfield
🏴󠁧󠁢󠁳󠁣󠁴󠁿 Stephen Flynn
🔵 Gillian Keegan

#Peston

youtube.com/live/_sOdZhH...
PESTON LIVE - 21/05/2025
YouTube video by Peston
youtube.com
Reposted by Andrew Bell
dingdingpeng.the100.ci
Another q for the stats people!
People worry about collinearity (cf blog post below).

Consider a scenario in which the collinear predictors are just controls to account for confounding.
Including both of them doesn't impair the precision with which the effect of interest is estimated, does it?
Jan Vanhove :: Blog - Collinearity isn’t a disease that needs curing
janhove.github.io
Reposted by Andrew Bell
essexsummerschool.bsky.social
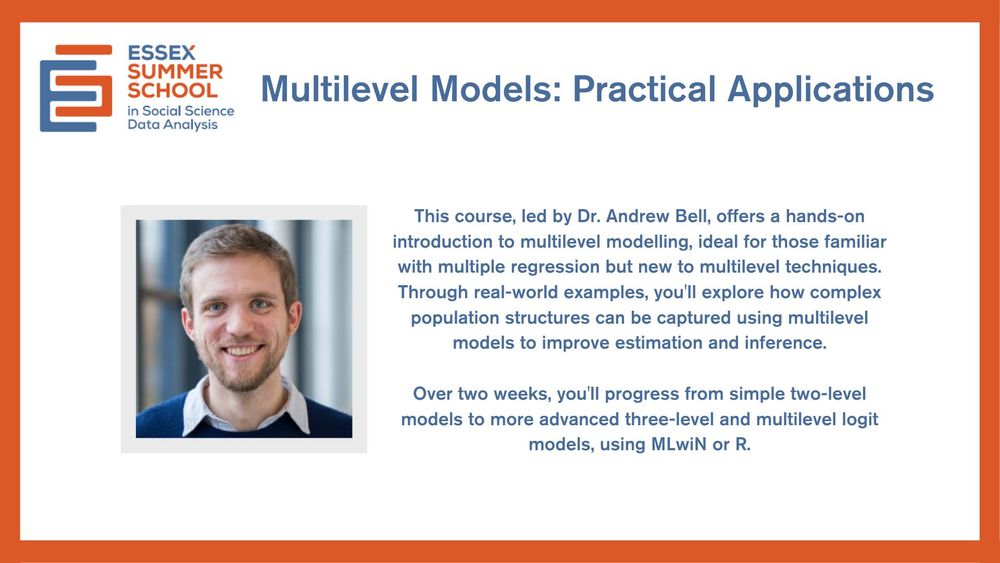
Multilevel Models: Practical Applications

Curious about multilevel modelling but not sure where to start?

Learn to recognise, build & interpret multilevel models using MLwiN or R, through real-world examples & hands-on practice.

Find out more: bit.ly/3Yj5I4f

#ESS2025
andrewjdbell.bsky.social
Still time to apply for this RA post- developing and applying the intersectional MAIHDA approach with @clarerevans.bsky.social and others. If you're a quantitative social scientist with an interest in quantitative methods and methods development, please apply! DMs open www.jobs.ac.uk/job/DMR190/r...
andrewjdbell.bsky.social
Come join George and I in Bristol, to learn about intersectional MAIHDA! bristol.ac.uk/cmm/software... @ncrm.ac.uk
Text reads: "An introduction to multilevel modelling for intersectionality research: the MAIHDA Approach. 19th June 2025. Instructors: Prof George Leckie and Dr Andrew Bell.

There are logos for Centre for multilevel modelling, NCRM, University of Sheffield, and UKRI
Reposted by Andrew Bell
tomecicuta.bsky.social
It’s my first project too! In fact, it’s also my first in epidemiology since I come from philosophy. :) I find stratified graphs based on social categories (like Hernández-Yumar, 2018) really interesting.
Reposted by Andrew Bell
clarerevans.bsky.social
A little story about this article & how teachers make a difference:

In 2013, I was a student in a social epidemiology class taught by the esteemed David Williams. He observed, with some frustration while we looked at a series of graphs, that we often lump people into the “Hispanic” category — 1/
lborrell.bsky.social
A news release on the paper with C. Nieves & @clarerevans.bsky.social
@cuny.edu @cunysph.bsky.social
#Hispanic #PublicHealth #EpiSky #MAIHDA #SocialEpi

sph.cuny.edu/life-at-sph/...
Reposted by Andrew Bell
sarg-scharr.bsky.social
New paper published in Social Science and Medicine 'An analysis of intersectional disparities in alcohol consumption in the US'. Led by @sophiebright.bsky.social, this study identifies several understudied groups who may have higher alcohol consumption than traditional methods would suggest.
An analysis of intersectional disparities in alcohol consumption in the US
Alcohol is one of the leading causes of preventable deaths in the United States (US). Prior research has demonstrated that alcohol consumption and rel…
www.sciencedirect.com
Reposted by Andrew Bell
dingdingpeng.the100.ci
New preprint! osf.io/preprints/ps...
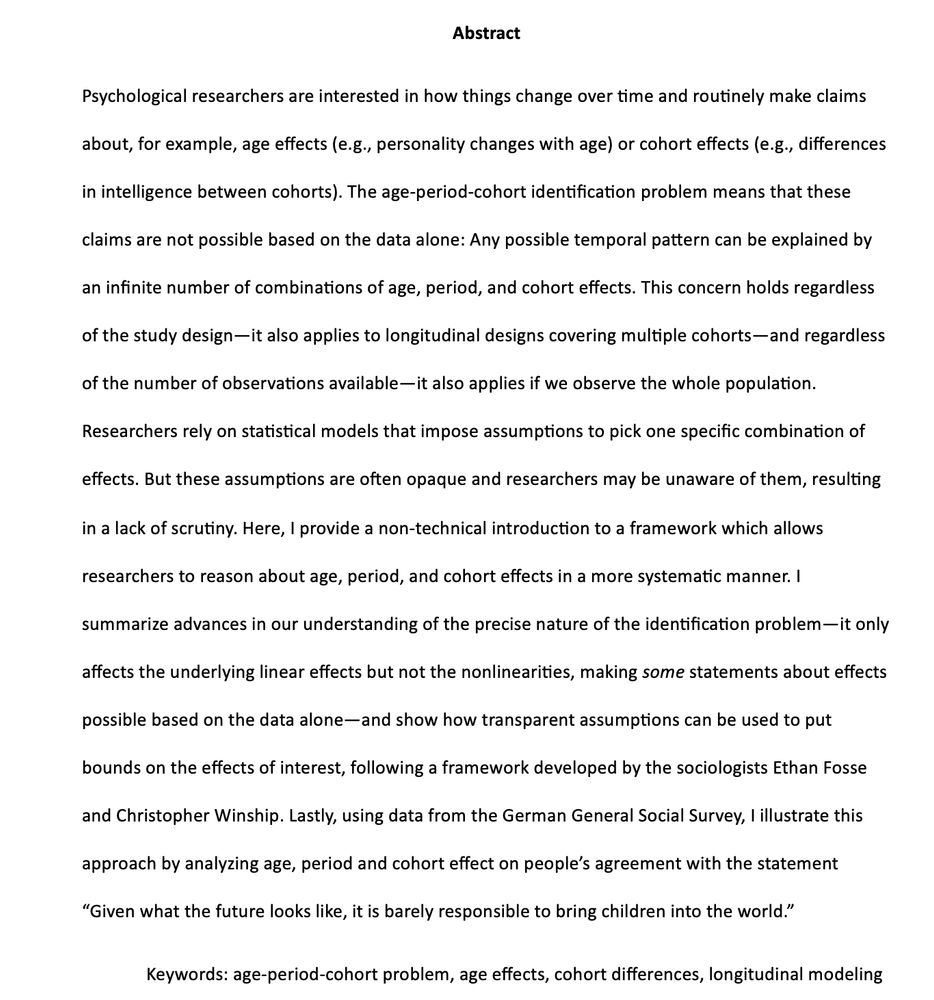
The age-period-cohort problem is something that many researchers are vaguely aware of. There have been very cool advances in how to reason about it which don't seem to be well-known in psych. So, I've written a primer!
Abstract
Psychological researchers are interested in how things change over time and routinely make claims about, for example, age effects (e.g., personality changes with age) or cohort effects (e.g., differences in intelligence between cohorts). The age-period-cohort identification problem means that these claims are not possible based on the data alone: Any possible temporal pattern can be explained by an infinite number of combinations of age, period, and cohort effects. This concern holds regardless of the study design—it also applies to longitudinal designs covering multiple cohorts—and regardless of the number of observations available—it also applies if we observe the whole population. Researchers rely on statistical models that impose assumptions to pick one specific combination of effects. But these assumptions are often opaque and researchers may be unaware of them, resulting in a lack of scrutiny. Here,...
Reposted by Andrew Bell
dingdingpeng.the100.ci
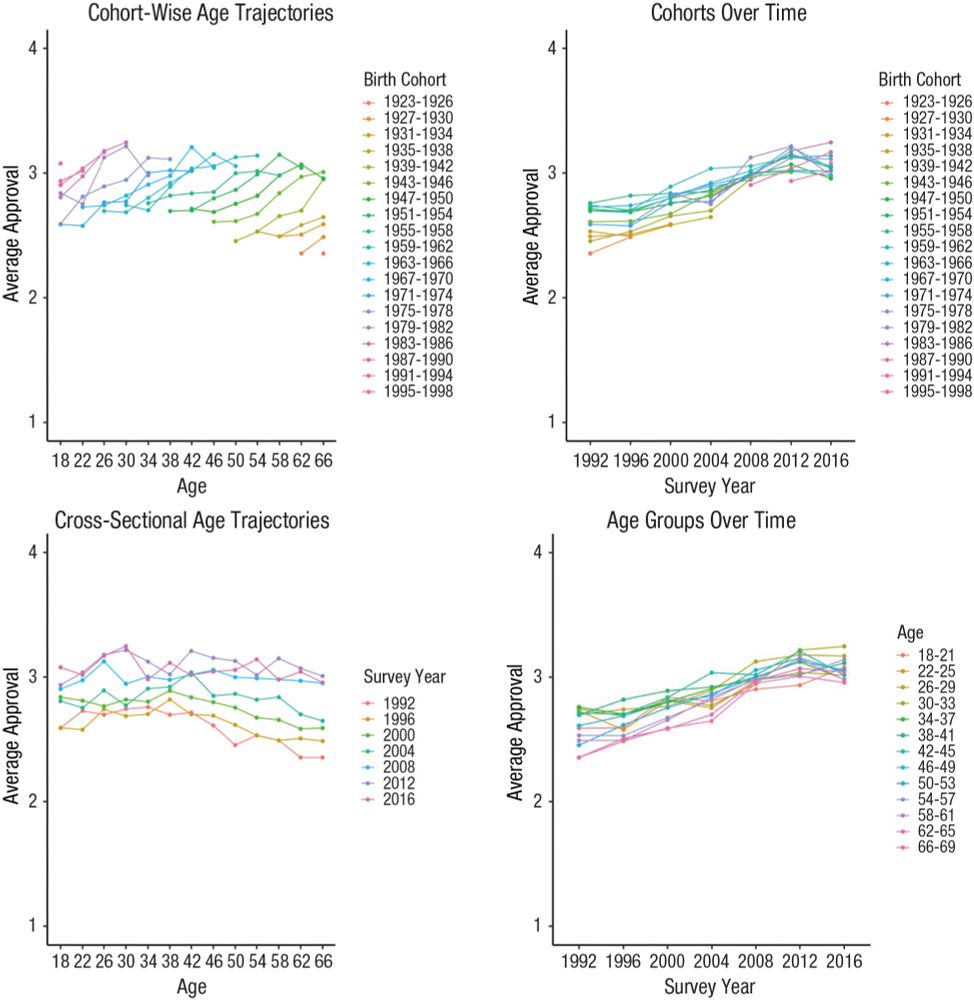
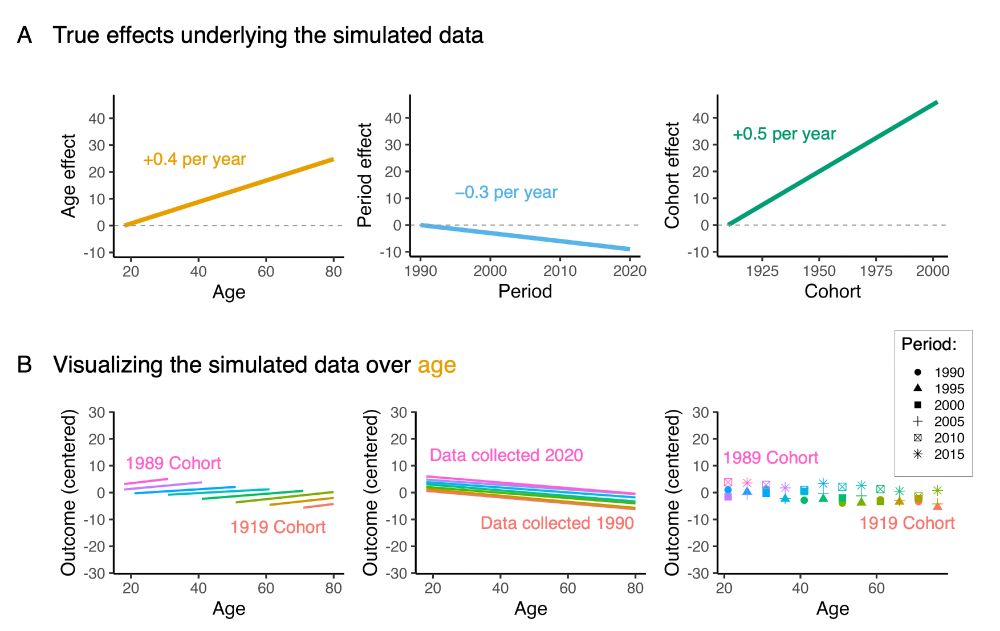
Rereading @andrewjdbell.bsky.social's 2020 paper on APC analysis & this is such a great example of how plots imply certain interpretations of the data.

Same underlying data but depending on how you connect the lines, the implied age effect looks completely different.