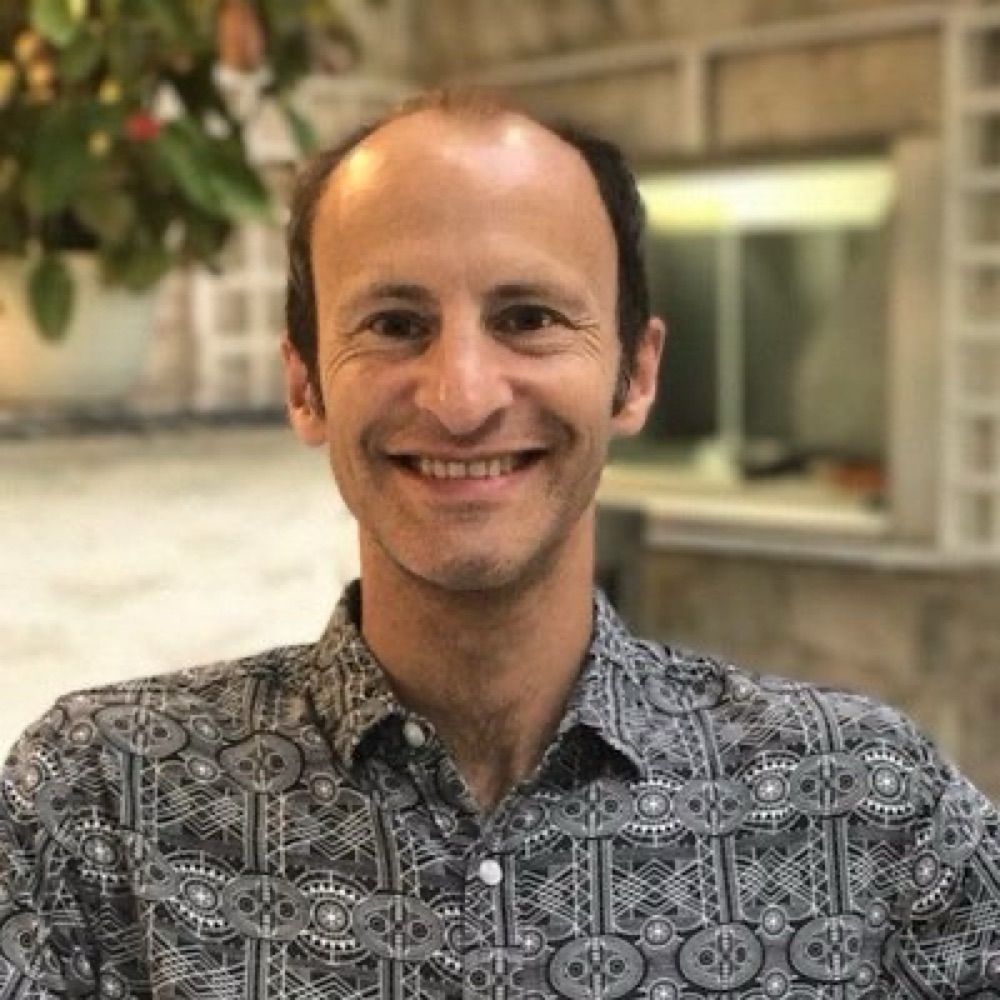
Ankit Bhandekar
@ankitbhandekar.com
170 followers
640 following
4 posts
🌏 Research Student @ University of Reading @unirdg-phd.bsky.social, previously w/ Computational Modelling Services - NCAS @ncas-uk.bsky.social
Interested in Aerosols, Climate Change, HPC, etc.
↗ http://www.ankitbhandekar.com/
Posts
Media
Videos
Starter Packs
Pinned

Ankit Bhandekar
@ankitbhandekar.com
· Feb 28

Delhi: how weather patterns and faraway mountains made this the world’s most polluted megacity
Don’t just blame the city’s cars, factories and building sites. Mountains and weather patterns make it particularly hard for pollution to escape.
theconversation.com
Reposted by Ankit Bhandekar


Reposted by Ankit Bhandekar


Reposted by Ankit Bhandekar


Reposted by Ankit Bhandekar

Reuters
@reuters.com
· Jun 10

India's solar boom keeps coal use in check so far in 2025
Surging electricity output from solar farms has led to a rare decline in fossil fuel power production in India so far in 2025, and is setting the stage for a potential drop in annual coal-fired power output in the world's second-largest coal consumer.
reut.rs
Reposted by Ankit Bhandekar


Reposted by Ankit Bhandekar

Reposted by Ankit Bhandekar

Reposted by Ankit Bhandekar


Reposted by Ankit Bhandekar
Andrew Freedman
@afreedma.bsky.social
· May 27
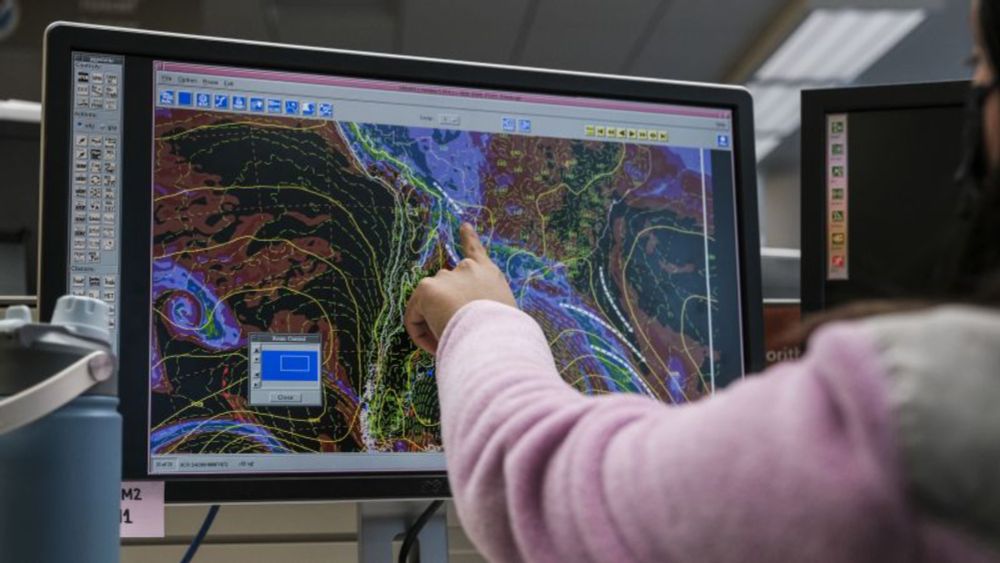
Climate and weather scientists are joining the anti-Trump resistance in the most ‘scientist-iest’ way | CNN
In the face of steep funding cuts for climate and weather research and forecasting, scientists have found a new way of engaging the public.
www.cnn.com
Reposted by Ankit Bhandekar

Esther
@elhopkins.bsky.social
· May 9
Petition: Introduce new air quality and PPE rules for health and social care settings
We want the Government to set new rules on air quality and infection control in health and social care settings, to prevent and control airborne infections, with new ventilation and filtration require...
petition.parliament.uk
Reposted by Ankit Bhandekar


Reposted by Ankit Bhandekar

Reposted by Ankit Bhandekar


Reposted by Ankit Bhandekar
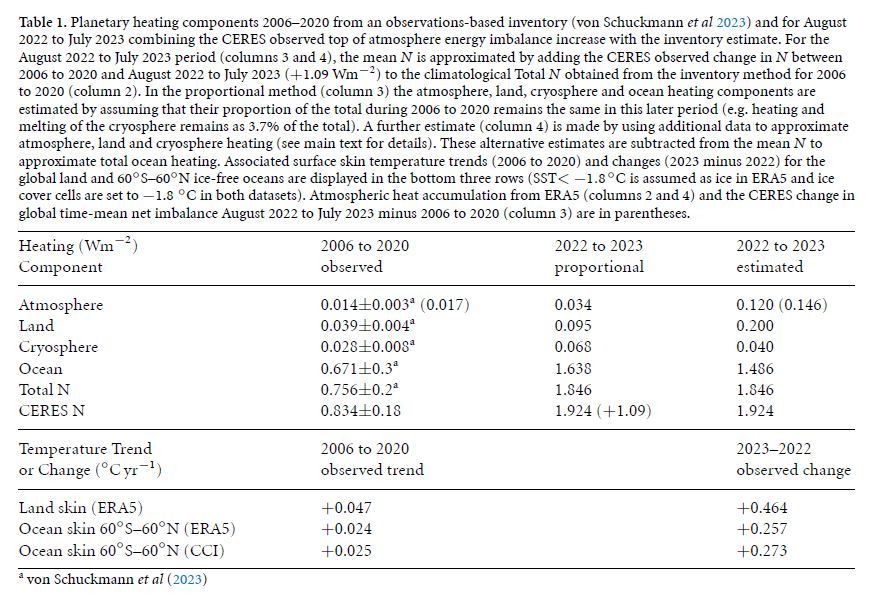
Richard Allan
@rpallanuk.bsky.social
· Mar 24

Reposted by Ankit Bhandekar


Reposted by Ankit Bhandekar

Dan Westervelt
@dwesty.bsky.social
· Mar 5

US State Department Kills Global Air Monitoring Program Researchers Say Paid for Itself
The initiative helped pressure the Chinese government to clean up the air in Beijing and was later expanded to dozens of cities around the world. Now, it’s been abruptly halted.
www.wired.com
Reposted by Ankit Bhandekar
Dan Westervelt
@dwesty.bsky.social
· Mar 4
Reposted by Ankit Bhandekar