


@axelpopaxel.bsky.social
Reposted

Der einzige Hinweis, den ich online finden kann, dass Hamas die Parole „From the River to the Sea“ verwendet, stammt von einer Fake-Webseite, die die israelische Regierung im November 2023 erstellte. Bestimmt nur ein Zufall, dass Deutschland kurz davor diese als Kennzeichen der Hamas verboten hat.

December 18, 2025 at 9:16 AM
Der einzige Hinweis, den ich online finden kann, dass Hamas die Parole „From the River to the Sea“ verwendet, stammt von einer Fake-Webseite, die die israelische Regierung im November 2023 erstellte. Bestimmt nur ein Zufall, dass Deutschland kurz davor diese als Kennzeichen der Hamas verboten hat.
Reposted

Check out the anomalous warmth across the #Arctic and #Antarctic over the last three months. And actually, all latitude bands averaged unusually warm too.
Plot shows zonal-mean temperature anomalies, where latitude = y-axis (not scaled by distance). GISTEMPv4 data using their 1951-1980 baseline.
Plot shows zonal-mean temperature anomalies, where latitude = y-axis (not scaled by distance). GISTEMPv4 data using their 1951-1980 baseline.

December 19, 2025 at 12:47 PM
Check out the anomalous warmth across the #Arctic and #Antarctic over the last three months. And actually, all latitude bands averaged unusually warm too.
Plot shows zonal-mean temperature anomalies, where latitude = y-axis (not scaled by distance). GISTEMPv4 data using their 1951-1980 baseline.
Plot shows zonal-mean temperature anomalies, where latitude = y-axis (not scaled by distance). GISTEMPv4 data using their 1951-1980 baseline.
Reposted

Much of the decline of #manufacturing employment at the industry level in #Germany reflects a shift of manufacturing tasks into service sector firms rather than a disappearance of manufacturing work.
Dominik Boddin & Thilo Kroeger
cepr.org/voxeu/column...
#EconSky
Dominik Boddin & Thilo Kroeger
cepr.org/voxeu/column...
#EconSky

December 17, 2025 at 9:10 AM
Much of the decline of #manufacturing employment at the industry level in #Germany reflects a shift of manufacturing tasks into service sector firms rather than a disappearance of manufacturing work.
Dominik Boddin & Thilo Kroeger
cepr.org/voxeu/column...
#EconSky
Dominik Boddin & Thilo Kroeger
cepr.org/voxeu/column...
#EconSky
Reposted

Turn old artificial Christmas trees into underwater reefs.
US Patent 12495775, issued today
US Patent 12495775, issued today

December 16, 2025 at 5:26 PM
Turn old artificial Christmas trees into underwater reefs.
US Patent 12495775, issued today
US Patent 12495775, issued today
Reposted
Looking back over the last 12 months, all latitude bands observed above average temperatures. This was largest in the Arctic region.
Plot shows zonal-mean surface air temperature anomalies, where latitude = x-axis (not scaled by distance). Data from NASA GISTEMPv4 (1951-1980 baseline).
Plot shows zonal-mean surface air temperature anomalies, where latitude = x-axis (not scaled by distance). Data from NASA GISTEMPv4 (1951-1980 baseline).

December 15, 2025 at 1:03 PM
Looking back over the last 12 months, all latitude bands observed above average temperatures. This was largest in the Arctic region.
Plot shows zonal-mean surface air temperature anomalies, where latitude = x-axis (not scaled by distance). Data from NASA GISTEMPv4 (1951-1980 baseline).
Plot shows zonal-mean surface air temperature anomalies, where latitude = x-axis (not scaled by distance). Data from NASA GISTEMPv4 (1951-1980 baseline).
Reposted


Reposted
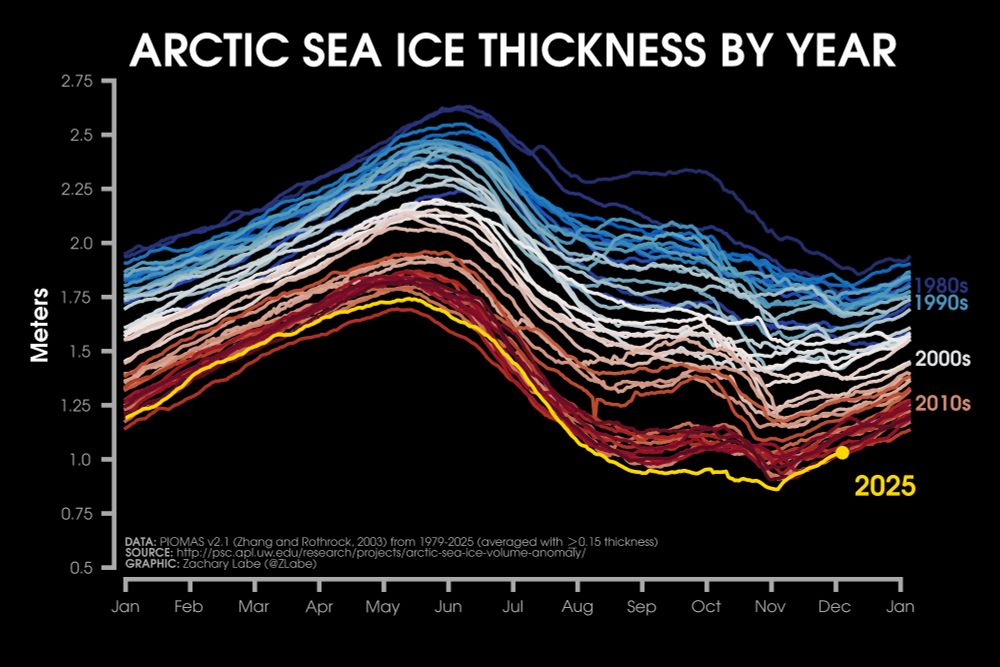
The average thickness of #Arctic sea ice reached a new all-time minimum this year (in this dataset)... 📉
More graphics: zacklabe.com/arctic-sea-i...
More graphics: zacklabe.com/arctic-sea-i...
December 10, 2025 at 11:44 PM
The average thickness of #Arctic sea ice reached a new all-time minimum this year (in this dataset)... 📉
More graphics: zacklabe.com/arctic-sea-i...
More graphics: zacklabe.com/arctic-sea-i...
Reposted
„German journalists and correspondents in Tel Aviv who spoke to Haaretz on the condition of anonymity described the attacks on von der Tann as a watershed moment – noting that she is the first correspondent on the ground in Israel to be targeted by Israeli officials.“ www.haaretz.com/world-news/e...

German reporters covering Gaza and Israel decry embassy's 'Atmosphere of intimidation'
Sophie Von Der Tann, the German Public Broadcaster's Correspondent in Tel Aviv, Has Been Subjected to What Colleagues and Press Freedom Advocates Say Is a 'Pattern' of Pressure Put on Journalists Cove...
www.haaretz.com
December 9, 2025 at 10:55 AM
„German journalists and correspondents in Tel Aviv who spoke to Haaretz on the condition of anonymity described the attacks on von der Tann as a watershed moment – noting that she is the first correspondent on the ground in Israel to be targeted by Israeli officials.“ www.haaretz.com/world-news/e...
Reposted

Our new analysis reveals: While new and deeper agreements would only moderately boost German gross domestic product (+0.7%), they are strategically vital. In uncertain times, they ensure stability and reduce critical dependencies. (neu)
@etiennehoera.d-64.social
Read the full analysis here ⤵️
@etiennehoera.d-64.social
Read the full analysis here ⤵️

Policy Brief - EU trade policy: More markets and closer cooperation would deliver moderate growth effects
US tariff policy, as well as intensifying competition from China, is dampening economic growth in Germany and many other export-oriented EU economies. In response, the EU is stepping up its efforts to...
www.bertelsmann-stiftung.de
November 27, 2025 at 8:19 AM
Our new analysis reveals: While new and deeper agreements would only moderately boost German gross domestic product (+0.7%), they are strategically vital. In uncertain times, they ensure stability and reduce critical dependencies. (neu)
@etiennehoera.d-64.social
Read the full analysis here ⤵️
@etiennehoera.d-64.social
Read the full analysis here ⤵️
Reposted
Last month was the hottest October on record for North America in this dataset... yet another extreme event
Data from @noaa.gov: www.ncei.noaa.gov/products/lan...
Data from @noaa.gov: www.ncei.noaa.gov/products/lan...

November 26, 2025 at 12:39 PM
Last month was the hottest October on record for North America in this dataset... yet another extreme event
Data from @noaa.gov: www.ncei.noaa.gov/products/lan...
Data from @noaa.gov: www.ncei.noaa.gov/products/lan...
Reposted

Keine dt. Wissenschaftsorganisation und m.w. auch keine Uni hat die völlige Zerstörung des Bildungssystems in Gaza verurteilt oder irgendein Mindestmaß an Solidarität gezeigt - aber eine wissenschaftliche Diskussion über den Scholastizid verbieten, das ist Zeichen eines „pluralistischen Diskurses“
„Die LMU als Ort des pluralistischen Diskurses“ 🤪

Die LMU sagt einen workshop mit palästinensischen academics ab, die über "targeting of Palestinian academia" sprechen wollten, nachdem der workshop durch einen brief des NJH an die unleitung getargeted wurde.
www.lmu.de/de/newsroom/...
www.lmu.de/de/newsroom/...
November 17, 2025 at 6:54 PM
Keine dt. Wissenschaftsorganisation und m.w. auch keine Uni hat die völlige Zerstörung des Bildungssystems in Gaza verurteilt oder irgendein Mindestmaß an Solidarität gezeigt - aber eine wissenschaftliche Diskussion über den Scholastizid verbieten, das ist Zeichen eines „pluralistischen Diskurses“
Reposted
„Diese Absage ist nicht nur ein Rückschlag für den akademischen Diskurs über palästinensische Wissenschaft im Kontext schwerster Völkerrechtsverletzungen, sie wirft zugleich fundamentale Fragen nach Wissenschaftsfreiheit, institutionellem Rassismus & universitärem Selbstverständnis auf.“
Here is the joint statement by @krisolwissenschaft.bsky.social, the German Middle Eastern Associations (DAVO) Committee on Academic Freedom and the Association of Palestinian and Jewish Academics on the cancellation of the event: "The Targeting of the Palestinian Academia" @lmumuenchen.bsky.social
November 18, 2025 at 4:53 PM
„Diese Absage ist nicht nur ein Rückschlag für den akademischen Diskurs über palästinensische Wissenschaft im Kontext schwerster Völkerrechtsverletzungen, sie wirft zugleich fundamentale Fragen nach Wissenschaftsfreiheit, institutionellem Rassismus & universitärem Selbstverständnis auf.“
Reposted
„Aber er hat eine Partei hinter – oder neben – sich, die eher nach links marschiert. Pragmatische Politiker werden an den Rand gedrängt.“ Warum können Politiker, die nach links unterwegs sind, keine Pragmatiker sein? www.sueddeutsche.de/politik/spd-...

SPD-Bürgermeister in Neukölln Martin Hikel: Eklat erschüttert die Berliner SPD
SPD: Der Neuköllner Bürgermeister und Berliner SPD-Chef Martin Hikel geht hart gegen Clan-Kriminalität vor. Nun straft ihn die SPD dafür ab.
www.sueddeutsche.de
November 10, 2025 at 12:09 AM
„Aber er hat eine Partei hinter – oder neben – sich, die eher nach links marschiert. Pragmatische Politiker werden an den Rand gedrängt.“ Warum können Politiker, die nach links unterwegs sind, keine Pragmatiker sein? www.sueddeutsche.de/politik/spd-...
Reposted

Öffentliche Forschungseinrichtungen treiben #Innovation in Europa voran! 🌍
Die zehn führenden europäischen Einrichtungen, darunter auch @fraunhofer.bsky.social, machen fast zwei Drittel aller Patentanmeldungen öffentlicher Forschungseinrichtungen aus.
👉 epo.org/public-research-study
Die zehn führenden europäischen Einrichtungen, darunter auch @fraunhofer.bsky.social, machen fast zwei Drittel aller Patentanmeldungen öffentlicher Forschungseinrichtungen aus.
👉 epo.org/public-research-study

October 23, 2025 at 10:46 AM
Öffentliche Forschungseinrichtungen treiben #Innovation in Europa voran! 🌍
Die zehn führenden europäischen Einrichtungen, darunter auch @fraunhofer.bsky.social, machen fast zwei Drittel aller Patentanmeldungen öffentlicher Forschungseinrichtungen aus.
👉 epo.org/public-research-study
Die zehn führenden europäischen Einrichtungen, darunter auch @fraunhofer.bsky.social, machen fast zwei Drittel aller Patentanmeldungen öffentlicher Forschungseinrichtungen aus.
👉 epo.org/public-research-study
Reposted
Great visual story on mega batteries that will go straight onto the PE of the green transition syllabus.
Note the 1GWh cutoff here but nonetheless: a nasty picture for Europe. Chile on the other hand, impressive.
ig.ft.com/mega-batteri...
Note the 1GWh cutoff here but nonetheless: a nasty picture for Europe. Chile on the other hand, impressive.
ig.ft.com/mega-batteri...

October 13, 2025 at 10:19 AM
Great visual story on mega batteries that will go straight onto the PE of the green transition syllabus.
Note the 1GWh cutoff here but nonetheless: a nasty picture for Europe. Chile on the other hand, impressive.
ig.ft.com/mega-batteri...
Note the 1GWh cutoff here but nonetheless: a nasty picture for Europe. Chile on the other hand, impressive.
ig.ft.com/mega-batteri...
Reposted
„Die Anmelderinnen hatten dazu aufgefordert, in schwarzer Kleidung mit roten Rosen zu erscheinen. Auch dies wird vom Ordnungsamt kritisiert: Damit werde ‚eine bekannte Hamas-Symbolik (rotes Dreieck auf schwarzem Grund) verwendet’.“ Dreieckige Rosen: wer züchtet sie nicht? www.faz.net/aktuell/rhei...

Verwaltungsgericht Frankfurt erlaubt Pro-Palästina-Demo
Die Stadt Frankfurt hatte die für den 7. Oktober geplante Pro-Palästina-Demonstration verboten. Das Verwaltungsgericht Frankfurt entschied nun: Die Kundgebung ist legal.
www.faz.net
October 6, 2025 at 9:53 PM
„Die Anmelderinnen hatten dazu aufgefordert, in schwarzer Kleidung mit roten Rosen zu erscheinen. Auch dies wird vom Ordnungsamt kritisiert: Damit werde ‚eine bekannte Hamas-Symbolik (rotes Dreieck auf schwarzem Grund) verwendet’.“ Dreieckige Rosen: wer züchtet sie nicht? www.faz.net/aktuell/rhei...
Reposted

When I read articles about democracy that do not even mention income and how people actually live, I think of this graph.
Economists and pol scientists study all kinds of things--but do they have an answer/hypothesis why is the outcome of democracy so (radically) different in South Africa and Poland?

March 30, 2025 at 9:17 PM
When I read articles about democracy that do not even mention income and how people actually live, I think of this graph.
Reposted
Die #Dati scheint damit vom Tisch zu sein. Immerhin sollen die Datipilot-Förderlinien wohl mitgenommen werden. Die #HAWs bekommen mit der "Deutschen Anwendungsforschungsgemeinschaft" (DAFG) eine eigene Förderorganisation, die perspektivisch in den PFI eingehen soll. #Transfer #Innovation
„Wir wollen D fit machen und #Bildung, #Forschung und #Innovation einen größeren Stellenwert in unserem Land geben. Dazu werden wir massiv investieren.“ Aus dem Ergebnispapier der AG Bildung, Forschung, Innovation. Hier die Zusammenfassung. #Koalitionsverhandlungen table.media/research/ana...

Ergebnisse der AG Bildung, Forschung und Innovation: Wofür es in den kommenden vier Jahren Geld geben soll
Ergebnisse der AG Bildung, Forschung und Innovation: Wofür es in den kommenden vier Jahren Geld geben soll.
table.media
March 27, 2025 at 2:21 PM
Die #Dati scheint damit vom Tisch zu sein. Immerhin sollen die Datipilot-Förderlinien wohl mitgenommen werden. Die #HAWs bekommen mit der "Deutschen Anwendungsforschungsgemeinschaft" (DAFG) eine eigene Förderorganisation, die perspektivisch in den PFI eingehen soll. #Transfer #Innovation