Kau)))
@carbon8.bsky.social
3.1K followers 330 following 420 posts
Earth/Ocean Scientist @ UArizona, #Tucson | Originally from #Bengaluru 🇮🇳 | #birds, #geology, #isotopes, mindfulness, #monsoons, #oceans, #paleoclimate, & weird music. eBird: https://ebird.org/profile/MTM0Njk2MA Web: thirumalai.geo.arizona.edu
Posts Media Videos Starter Packs
Pinned
carbon8.bsky.social
🚨New work🚨 led by Ph.D. student Dipesh Chuphal (IIT Gandhinagar), shows that the recent drying of the Ganga River basin is unprecedented in 1,300 years—more severe than historical famines. This ~multidecadal drying appears forced, but many models do not capture it. ☔️ 🌧️

www.pnas.org/doi/10.1073/...
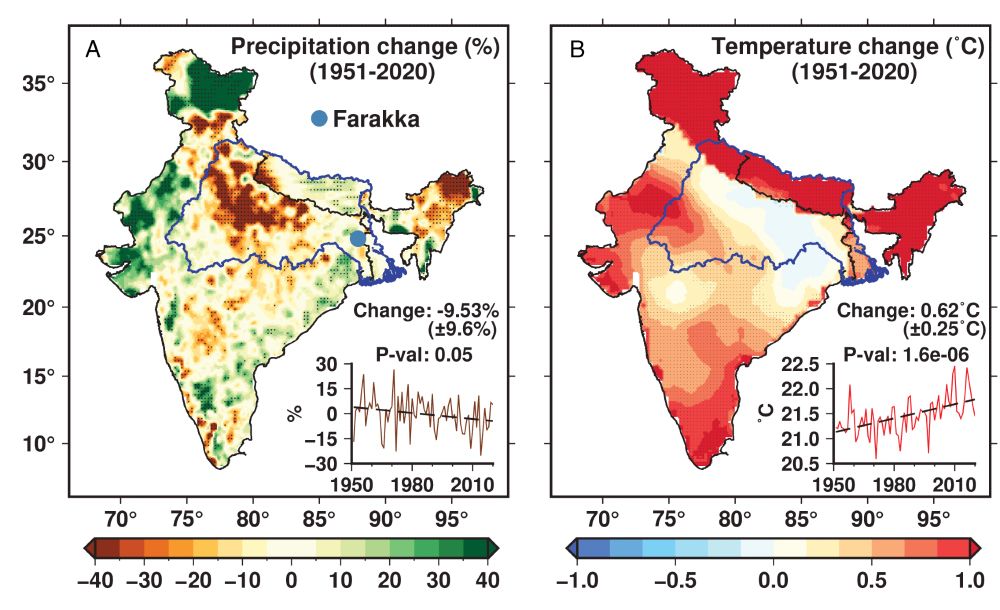
Time series of standardized streamflow anomaly for the Ganga River from year 700 to 2020 (derived from a hydrological model and from the Monsoon Asia Drought Atlas built from tree rings). The plot shows mostly balanced wet (blue/green bars) and dry (brown bars) years until the 20th century, when the black moving-average line dips sharply after 1990. The 1991–2020 mean (blue horizontal line) is well below the range of previous 1,300 years. Orange dots mark major documented historical droughts, but the recent drying is clearly the most severe. Observed changes in precipitation and temperature between 1951 and 2020. Spatial distribution of change in (A) annual precipitation (%) and (B) annual mean temperature (°C) between 1951 and 2020 based on the Sen’s slope calculation. Grids with statistically significant trends (P <= 0.05), based on the Mann–Kendall test, are highlighted with stippling. The Inset panels in (A) and (B) represent the interannual variability in precipitation anomaly (%) and temperature (°C) averaged
for the Ganga River Basin (blue boundary). The total change in average precipitation and temperature over the GRB during 1951−2020, estimated using the Sen’s slope, is statistically significant (P-value <= 0.05) based on the Mann–Kendall test.
Reposted by Kau)))
oceanandclimate.bsky.social
I'm also quite happy that Yair Rosenthal (a friend and mentor) and @anya-hess.bsky.social wrote a Perspective on our work.

www.science.org/doi/epdf/10....
An illustration showing the new view of the equatorial Pacific temperature, nutrients, upwelling, and subsurface oxygen during the Pliocene epoch (5.3 to 2.6 million years ago)
Reposted by Kau)))
jfarmersalmanac.bsky.social
Very excited to be a part of this epic journey with @oceanandclimate.bsky.social. Check out our #NSFfunded paper published in @science.org today & his thread below. After that, come back here for more... (1/n)
carbon8.bsky.social
Perhaps—but I’d think us geologists would *specifically* be interested in (& pay detailed attention to) the exact physical mechanism through which things get time-averaged over long, geological timescales…I suspect it has more to do with our training being decoupled w atmos science/meteorology.
Reposted by Kau)))
drkimwood.bsky.social
When a hurricane can take off, boy does it take off:
the 2025 Atlantic hurricane season story.

Watch Humberto also rapidly intensify from a lopsided tropical storm to a major hurricane.

Notable intensity changes:
- 40 to 125 kt within 48 hours
- 65 to 125 kt within 24 hours
carbon8.bsky.social
It's unfortunate and inaccurate—particularly in speleothem isotope studies, where we geoscientists seem to forget that there is a thing that does *A LOT* of stuff to the isotopes called "the atmosphere", located between the ocean and the cave...
carbon8.bsky.social
It's amusing to me how geologists use *extremely* high-resolution datasets for topography, but then forget (?/ignore/don't know?) that equally high-resolution data exists for the atmosphere... and that unrealistic/artistic/fantastical depictions of winds are not necessary (nor scientific). /rant
A map depicting much of central and South Asia, the Indian Ocean, with very high resolution topography, with a number of cave sites depicted, and absolutely fantastic(/unrealistic) singular wind arrows purported to represent different wind regimes.
carbon8.bsky.social
🚨New work🚨 led by Ph.D. student Dipesh Chuphal (IIT Gandhinagar), shows that the recent drying of the Ganga River basin is unprecedented in 1,300 years—more severe than historical famines. This ~multidecadal drying appears forced, but many models do not capture it. ☔️ 🌧️

www.pnas.org/doi/10.1073/...
Time series of standardized streamflow anomaly for the Ganga River from year 700 to 2020 (derived from a hydrological model and from the Monsoon Asia Drought Atlas built from tree rings). The plot shows mostly balanced wet (blue/green bars) and dry (brown bars) years until the 20th century, when the black moving-average line dips sharply after 1990. The 1991–2020 mean (blue horizontal line) is well below the range of previous 1,300 years. Orange dots mark major documented historical droughts, but the recent drying is clearly the most severe. Observed changes in precipitation and temperature between 1951 and 2020. Spatial distribution of change in (A) annual precipitation (%) and (B) annual mean temperature (°C) between 1951 and 2020 based on the Sen’s slope calculation. Grids with statistically significant trends (P <= 0.05), based on the Mann–Kendall test, are highlighted with stippling. The Inset panels in (A) and (B) represent the interannual variability in precipitation anomaly (%) and temperature (°C) averaged
for the Ganga River Basin (blue boundary). The total change in average precipitation and temperature over the GRB during 1951−2020, estimated using the Sen’s slope, is statistically significant (P-value <= 0.05) based on the Mann–Kendall test.
Reposted by Kau)))
sayakbasu.bsky.social
E-see you all the climate enthusiasts at our upcoming ICCP speleothem lecture series on 25th September with Dr. Stacy Carolin
Zoom link: pusan.zoom.us/j/8901635789...
Reposted by Kau)))
ranjeevlikesclams.bsky.social
Happy #fossilfriday
Checkout this cool #Mississippian ? #brachiopod which I believe is #Composita encrusted by some #bryozoa #fossilsofmissouri
carbon8.bsky.social
🌊 🔬 New in #Marine #Geology:

Ph.D. student Ammoose Jayan (CU Kerala/Fulbright @uarizona.bsky.social) shows that "pink" #foraminifera Globigerinoides ruber survived in the Indian Ocean until 8 kyr BP—and did not go extinct in the Indian Ocean at 120 ka!

🔗 doi.org/10.1016/j.margeo.2025.107656
Microscope images of Globigerinoides ruber (pink) shells from Bay of Bengal core MGS30. Panels show the same specimens in different orientations: umbilical, spiral, and ventral views. Left side: light microscope and high-resolution color images showing pink to orangish-pink shell tint. Right side: scanning electron microscope (SEM) images highlighting surface texture and chamber structure. Map of the Bay of Bengal and Arabian Sea showing sea surface salinity in winter (left panel) and summer (right panel). Core site MGS30 is marked with a star in the eastern Bay of Bengal, with additional sites U1457, U1446, MD77, and RVS2 labeled. Seasonal arrows show East India Coastal Current (EICC) and West India Coastal Current (WICC) flow directions. Color shading indicates salinity, with fresher water in blue and saltier water in yellow.
carbon8.bsky.social
I got lucky with this stunning Indian White-Eye seen slightly outside #Bengaluru, #India!

🪶
A photograph of an Indian White-Eye perched on a green stem of a plant—the bird has a bright yellow head with a brilliant white eye-ring, piercing brown eyes, and an angular tiny black beak. A photograph of an Indian White-Eye perched on a brown stem of a plant—the bird has a bright yellow head and back, with black feather tips, and has a brilliant white eye-ring, piercing brown eyes, and an angular tiny black beak.
carbon8.bsky.social
Here's a magnificent (albeit somewhat clunky) male #Peafowl in flight seen close to #Bengaluru last week.

#peacock #birds

🪶
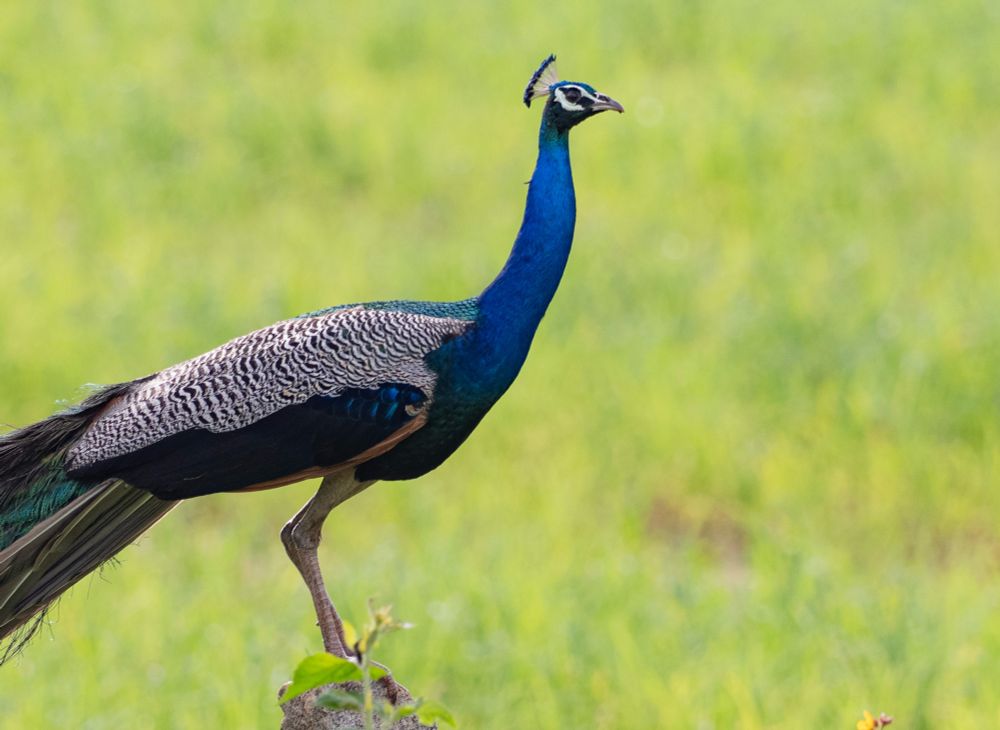
A peacock—a brilliant blue bird with a long neck, a tiny crown of feathers above the head, white eyestripes, and scaled feathers perched on a rock. A peacock in flight—with large rufous wings spread apart, and brilliant green tail feathers tangled together in flight. A peacock in flight Fourth photo of a peacock in flight
Reposted by Kau)))
ericdienstfrey.bsky.social
Crazy that you can no longer hear the original mono sound designs for A CLOCKWORK ORANGE, THE SHINING, and FULL METAL JACKET. The only versions available are the remixed 5.1 versions, which often feature different sounds.

An excerpt from Valerio Sbravatti's brilliant video essay on the subject:
Reposted by Kau)))
andrejpaleo.bsky.social
Nice gift "Plate Tectonics Flip Book" from the author Ch. Scotese to our tectonist J. Lazauskienė 😀
Reposted by Kau)))
oceandrea.bsky.social
Need to calibrate your δ18Osw-based proxies, but can't find the right data? We've got you, FAIR! Check out our new @pages-ipo.bsky.social seawater δ18O database preprint at ESSD! (With Alyssa Atwood, @thomasfelis.bsky.social, @kimcobb.bsky.social, and more!) 🌊🧪

essd.copernicus.org/preprints/es...
https://essd.copernicus.org/preprints/essd-2025-467/🌊🧪
Reposted by Kau)))
ianhall.bsky.social
I have a feeling reality is about to hit…#ICP15 😬

Biomineralisation in foraminifera: how do they do it and does it affect application of proxies?

By Leenart de Nooijer
carbon8.bsky.social
Now at #ICP15, River Shen from #NTU #Taiwan gives our first talk on #spleothems incl. their use as #hydroclimate records, how his team is pushing the bounds of U/Th #geochronology, & various applications of #speleothem #geochemistry including for #temperature change, #weathering, and #pollution.
A photograph of Dr. River Shen from National Taiwan University on stage at #ICP15 with a slide entitled “Recent advances in U-Th chronology and geochemical proxies for reconstructing Asian monsoon variability from speleothems.”
carbon8.bsky.social
Happening now at #ICP15: @triptychphrases.bsky.social shifts gears from Asia & provides a comprehensive overview of #Quaternary changes in the North American #Monsoon & talks abt plausible parallels between past and future climate #extremes 🌊
A photograph of Dr. Tripti Bhattacharya on stage at #ICP15 at the #IISc auditorium—with a slide behind her showing a global map of precipitation.
carbon8.bsky.social
After coffee ☕️, Ed Hathorne from @geomarkiel.bsky.social talks about how marine sedimentary #clays & radiogenic #isotopes can be used to constrain long-term changes in #weathering, and thus, Indian summer #monsoon intensity in Bay of Bengal sediments. 🌊
A photograph of Dr. Ed Hathorne on stage at #ICP15 at the #IISc auditorium—with a slide behind him titled “South Asian Monsoon climate control of Neogene to Pleistocene silicate weathering”. A photograph of Dr. Ed Hathorne from #GEOMAR on stage at #ICP15 at the #IISc auditorium—with a slide behind him containing many photographs of core sections of Bay of Bengal sediments.
carbon8.bsky.social
Last but not least in the morning #ICP15 session, a fantastic overview of #Neogene and(/versus) #Cenozoic evolution of the Indian summer #monsoon in response to changes in topography/orography & ocean circulation in simulations & paleo-records by @antacl.bsky.social

🌊 (3/3)
A photograph of Dr. Anta Clarisse Sarr on stage at #ICP15 at the #IISc auditorium—with a slide behind her titled “What is the South Asian summer monsoon”.
carbon8.bsky.social
Next, Pedro DiNezio talked abt how assessments of future #tropical hydroclimate responses to global change (including #monsoons), must factor in changes in the #AMOC —paper here: www.nature.com/articles/s41...

🌊 (2/3)
A photograph of Dr. Pedro DiNezio on stage at #ICP15 at the #IISc auditorium—with a slide behind him titled “Glacial lessons on future monsoon change”.
carbon8.bsky.social
Today is the #Monsoon session at #ICP15 —great talks this AM, with session kicked off by Prof. AD Singh from BHU 🇮🇳 on Indian-margin marine sediment reconstructions of Indian Summer Monsoon strength using #foraminfera -based water-column indicators. Eg www.sciencedirect.com/science/arti...

🌊 (1/3)
Changes in the upper water-column structure of the eastern equatorial Indian Ocean during 12.8–4.7 ka
The eastern equatorial Indian Ocean (EEIO), a pivotal region of the Indo-Pacific Warm Pool, plays a crucial role in modulating both the regional and g…
www.sciencedirect.com
carbon8.bsky.social
🌊
ianhall.bsky.social
How would a weaker AMOC affect the global tropics?

We are about to find out with the next #ICP15 talk by Pedro DiNezio
Reposted by Kau)))
ianhall.bsky.social
Having experienced a bit of the intensity of the Indian Monsoon this week at #ICP15, it’s good to start day 4 with an update on its evolution and spatio-temporal variability from A.D. Singh
carbon8.bsky.social
Unfortunately I don’t think these are being recorded in any fashion. I’d be glad to direct you towards the scientific articles for something specific if you’d like, though!