Donald Szlosek
@dszlosek.bsky.social
820 followers 4.4K following 170 posts
Biostatistician @IDEXX formerly at harvardmed, @BIDMChealth, @nasa. Big data, clinical trials, and medical diagnostics. Mainer. Opinions are my own. he/him
Posts Media Videos Starter Packs
Reposted by Donald Szlosek
pwgtennant.bsky.social
"Uncooperative statistician": the term used (typically by a senior clinician) to describe a well-trained and knowledgeable statistician who refuses to conduct flawed or fraudulent research.
Reposted by Donald Szlosek
andrew.heiss.phd
If you've ever wanted to learn how to make beautiful websites with #QuartoPub and #rstats , check out this workshop I'm giving in a couple weeks! It'll be a blast (and we're covering Quarto's brand new _brand dot yaml system!)
stathorizons.bsky.social
Learn to create and publish a professional, data-focused website in “Create an Online Presence with Quarto Websites” on October 16-17, with @andrew.heiss.phd‬! Discover how to use #Quarto to build a variety of websites like personal portfolios, research compendiums, and interactive dashboards.
Quarto Websites | Online Seminar | Code Horizons
This online course taught by Andrew Heiss, Ph.D., teaches you how to use Quarto to build a variety of data-focused websites.
codehorizons.com
Reposted by Donald Szlosek
hetanshah.bsky.social
Nice chart from @ourworldindata.org showing the contrast between what Americans die of (heart disease and cancer) v what the US media reports on (homicide and terrorism). This naturally leads to it being trickier to build a fact based world view
ourworldindata.org/does-the-new...
What Americans die from
and the causes of death the US media reports on
Causes of death in the US in 2023
Heart disease (29%)
Cancer (26%)
Accidents (9.5%)
Stroke (6.9%)
Lower respiratory diseases
(6.2%)
Alzheimer's disease (4.8%)
Diabetes (4.0%)
Kidney failure (2.4%)
Liver disease (2.2%)
Homicide (<1%)
Terrorism (<0.001%)|
COVID-19 (2.1%)
Influenza/Pneu
monia (19%6)

Media coverage of these causes of death in 2023 in...
The New York Times
The Washington Post
Fox News
Heart disease (2.8%)
Heart disease (2.9%)
Cancer (4.1%)
Cancer (4.7%)
Accidents (5.9%)
Cancer (3.8%)
Accidents (6.1%)
Accidents (9.7%)
Suicide (4.1%)
Suicide (3.3%)
COVID-19 (6.0%)
COVID-19 (7.9%)
Suicide (3.8%)
COVID-19 (5.3%)
Drug overdose (7.5%)
Drug overdose (9.8%)
Drug overdose (9.5%)
Cancer (26%)
Accidents (9.5%)
Stroke (6.9%)
Lower respiratory diseases
(6.2%)
Alzheimer's disease (4.8%)
Diabetes (4.0%)
Kidney failure (24%)
Suicide (2.1%0)
COVID-19 (2.1%0
Homicide (42%)
Homicide (52%)
Homicide (46%)
Terrorism (18%)
Terrorism (12%)
Terrorism (11%)
Homicide (<1%)
Terrorism (<0.001%)
Note: Based on the share of causes of death in the US and the share of mentions for each of the causes in the New York Times, the Washington Post and Fox News. All values are normalized to 100%, so the shares are relative to all deaths caused by the 12 most common causes + drug overdoses, homicides and terrorism. These causes account for more than 75% of deaths in the US.
A "media mention" is a published article in one of the outlets which mentions the cause (e,g. "influenza) or related keywords (e.g. "fu") least twice.
Data sources: Media mentions from Media Cloud (2025): deaths data from the US CDC (2025) and Global Terrorism Index.|
CC BY
dszlosek.bsky.social
If I'm doing a lot of written work, I would get tired of writing the sigma notation or the triangular numbers you suggested. I see this as an easy and fast way of saving my wrists from cramping!
Reposted by Donald Szlosek
solomonkurz.bsky.social
In Ch 19 (nyu-cdsc.github.io/learningr/as...) of his 2nd edition, Kruschke used *residual* SD as a standardizer for group differences from a multilevel ANCOVA. Is there any precedent for using a *residual* SD as a standardizer for a standardized mean difference effect size? #RStats
nyu-cdsc.github.io
dszlosek.bsky.social
I always wondered if there was a shorthand for summation similar to factorials #math #mathsky #statssky #statistics
Reposted by Donald Szlosek
noahgreifer.bsky.social
Thinking about odds ratios...

An odds is a ratio of events to non-events. For example, if the event is survival, the odds of survival is the number of survivors per death. If the event is getting a disease, the odds is the number of diseased individuals per healthy individual.
Reposted by Donald Szlosek
richarddmorey.bsky.social
For me this is a hard red line in psychological science. If you advocate the use of "silicon samples" you do not understand what it is we're supposed to be doing (and likely don't understand LLMs, or are a grifter). Luckily I haven't seen much of this among people I'd consider my peer group.
Except from Table 1 of Guest & van Rooij, 2025:

3) Displacement of Participants

“I can use AI instead of participants to perform tasks and generate data.”

The providence of the data used in these models indicates it is not ethically sourced, falling below standards for our discipline, involving sweatshop labour and no consent for private data used in experiments. The output can contain direct original input data (i.e. double dipping), but smoothed to remove outliers, conform to our pre-existing ideas of what it should look like (data fabrication), and all-round irreplicable. Psychology is meant to study humans, not patterns at the output of biased statistical models.
Reposted by Donald Szlosek
epiellie.bsky.social
If you’ve been following the RFK Jr autism news, then you’ve probably heard that there’s a systematic review “proving” Tylenol causes autism.

Here’s my review of that paper👇🏼

open.substack.com/pub/epiellie...
The best evidence Tylenol causes autism isn't great
On Monday, RFK Jr announced Tylenol ‘causes’ autism referencing three studies as evidence. Let's dive in.
open.substack.com
Reposted by Donald Szlosek
epiellie.bsky.social
Which one should I do next? The big Swedish study that RFK & his buddies pretend doesn’t exist? Or one of the other 2 studies he mentioned at the press conference?

Vote by commenting!
epiellie.bsky.social
If you’ve been following the RFK Jr autism news, then you’ve probably heard that there’s a systematic review “proving” Tylenol causes autism.

Here’s my review of that paper👇🏼

open.substack.com/pub/epiellie...
The best evidence Tylenol causes autism isn't great
On Monday, RFK Jr announced Tylenol ‘causes’ autism referencing three studies as evidence. Let's dive in.
open.substack.com
Reposted by Donald Szlosek
statsepi.bsky.social
It is *impossible* to "adjust for socioeconomic status" in a regression model. Discuss.

And good morning! 🌞
Reposted by Donald Szlosek
andrew.heiss.phd
Just posted an updated/revised version of this “Statistical Methods in Public Policy Research” chapter, now under review post-R&R 🤞

I'm kinda partial and unbiased here, but I really really like this piece!

HTML/PDF: stats.andrewheiss.com/snoopy-spring/
SocArXiv: doi.org/10.31235/osf...
Statistical Methods in Public Policy Research
Chapter for the Oxford Research Encyclopedia on Public Policy

This essay provides an overview of statistical methods in public policy, focused primarily on the United States. The essay traces the historical development of quantitative approaches in policy research, from early ad hoc applications through the 19th and early 20th centuries, to the full institutionalization of statistical analysis in federal, state, local, and nonprofit agencies by the late 20th century. It then outlines three core methodological approaches to policy-centered statistical research across social science disciplines: description, explanation, and prediction. In descriptive work, researchers explore what exists and examine any variable of interest to understand their different distributions and relationships. In explanatory work, researchers ask why does it exist and how can it be influenced. The focus of the analysis is on explanatory variables (X) to either (1) accurately estimate their relationship with an outcome variable (Y), or (2) causally attribute the effect of specific explanatory variables on outcomes. In predictive work, researchers ask what will happen next and focus on the outcome variable (Y) and on generating accurate forecasts, classifications, and predictions from new data. For each approach, the essay examines key techniques, their applications in policy contexts, and important methodological considerations. The discussion then considers critical perspectives on quantitative policy analysis framed around issues related to a three-part “data imperative” where governments are driven to count, gather, and learn from data. Each of these imperatives entail substantial issues related to privacy, accountability, democratic participation, and epistemic inequalities—issues at odds with public sector values of transparency and openness. The conclusion identifies some emerging trends in public sector-focused data science, inclusive ethi… Table of contents
Introduction
1 Brief History of Statistics in Public Policy
2 Core Methodological Approaches
2.1 Description
2.2 Explanation
2.2.1 Estimation, Inference, and Hypothesis Testing
2.2.2 Causal Attribution and Causal Inference
2.3 Prediction
3 The Pitfalls of Counting, Gathering, and Learning from Public Data
4 Future Directions
Further Reading
References
dszlosek.bsky.social
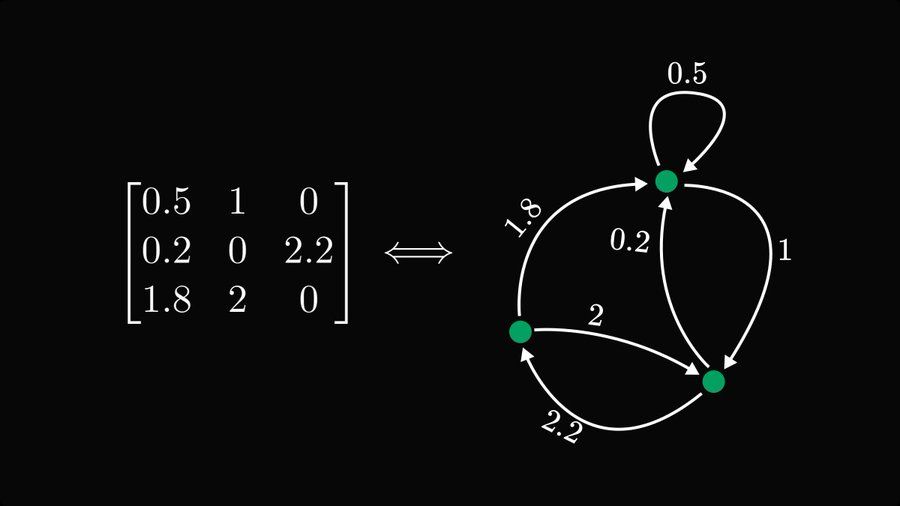
The single most undervalued fact of linear algebra: matrices are graphs, and graphs are matrices.

Encoding matrices as graphs is a cheat code, making complex behavior simple to study. #Statistics #Mathemathis #Math

Excellent example from @tivadardanka.bsky.social
dszlosek.bsky.social
R+AI - Join us at R+AI 2025, our inaugural conference dedicated to the open-source R community and every facet of artificial intelligence - 100% online
Reposted by Donald Szlosek
chelseaparlett.bsky.social
Data Science programs often put too little emphasis on causal inference, and it’s hurting their graduates on the job market! The econometrics people are coming for your jobs lol
Reposted by Donald Szlosek
bharrap.bsky.social
Will I be celebrating my birthday on October 20th? No!

Will I be celebrating World #Statistics Day by joining several much cooler panelists to discuss the topic "data we can trust"? Absolutely!

🗓️ October 20th, 1pm AEDT
📍 Online webinar
🔗 statsoc.org.au/event-6365055

#statssky #databs #datascience
Statistical Society of Australia - World Statistics Day Webinar – “Data we can trust”
statsoc.org.au
Reposted by Donald Szlosek
libbyheeren.bsky.social
Tell me something you do when you code that other people would tell you that you shouldn't do.

Tell me the rules you break!

I'll go first: I work in untitled files in the wrong project directories all the time. Like, all the time. Yes, I do tend to lose things 😂 #databs #rstats #python
Reposted by Donald Szlosek
weare.rladies.org
Did you know there are two contests happening right now? ✨

📊 Table Contest: use any #RStats or #Python package.
📈 Plotnine Contest: use the Plotnine #Python package.

Show off your skills, share your work, and earn some well-deserved open-source cred!

Learn more: posit.co/blog/announc...
posit.co
Posit @posit.co · 14d
Want to win the 2025 Table Contest? Get inspired by @bamattre.bsky.social's interactive table, which turns the Board Game Geek database into a practical tool ✨

His entry: bamattre.github.io/boardgames/

Submit your table using any #RStats or #Python package!

Details: github.com/rich-iannone...
Top Ranked Board Game Table Contest Entry
dszlosek.bsky.social
Anyone else ever feel like this? #StatsSky #Statistics
dszlosek.bsky.social
A nice discussion on stats.exchange on central limit theorem including how Socrates would have handled it #Statistics #StatsSky: stats.stackexchange.com/questions/47...
stats.exchange
Reposted by Donald Szlosek
tyk314.net
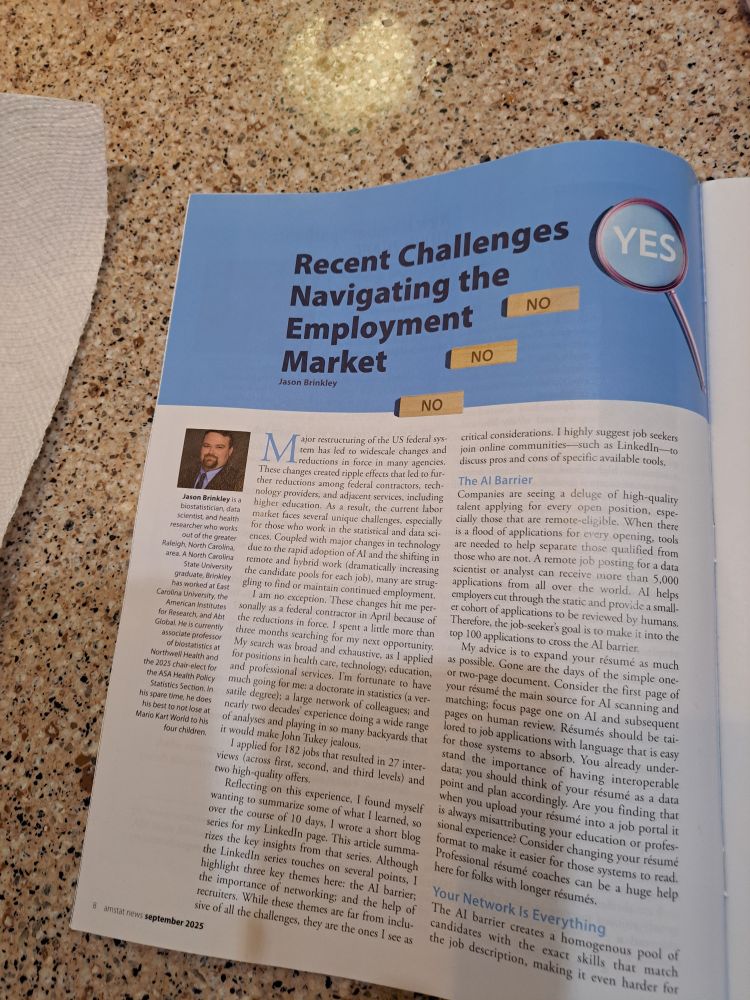
@amstatnews.bsky.social covers @drjasonbrinkley.bsky.social 's recent job search. It is a great piece, #statssky #hpss #geronsky and #AIsky.
Jason Brinkley talks about his job search in AMSTAT News.