Frank Hull
@frankiethull.bsky.social
330 followers 170 following 360 posts
Here for R, MLOps, Energy, & local LLMs
Posts Media Videos Starter Packs
frankiethull.bsky.social
left join left join left join left join
frankiethull.bsky.social
Somewhat tabular structured so not too bad. 15-minute interval time series with ~280 columns each. Data is split by various IDs into separate files.
frankiethull.bsky.social
Super both! It's timeseries too 🤪
frankiethull.bsky.social
I just don't want to get stuck in a REM EDA loop all weekend. Many such cases
frankiethull.bsky.social
Just got access to a new 300TB dataset on Friday afternoon and it's really hard to call it a day 😅 #databs
Reposted by Frank Hull
ivelasq3.bsky.social
In June, I gave a webinar at @amstatnews.bsky.social GASP 2025, "Quarto--To Tell Your Story with Data"

and the recording is now online!

🕸️ #RStats & #Python materials: ivelasq-gasp2025-quarto.share.connect.posit.cloud
📹 Recording: www.youtube.com/watch?v=P5Yf...
🐙 GitHub: github.com/ivelasq/2025...
Quarto To Tell Your Story with Data GASP 2025
frankiethull.bsky.social
I hadn't really used this much but tried it out yesterday. I had many small csvs formatted the same. So I took @randvegan.bsky.social's advice, read_csv will read and bind a vector of file names automatically! 🙌🏻
frankiethull.bsky.social
readr::read_csv is all you need
Reposted by Frank Hull
jonthegeek.com
@dslc.io welcomes you to week 39 of #TidyTuesday! We're exploring Crane Observations at Lake Hornborgasjön, Sweden (1994–2024)!

📁 https://tidytues.day/2025/2025-09-30

#RStats #PyData #JuliaLang #DataViz #tidyverse #r4ds
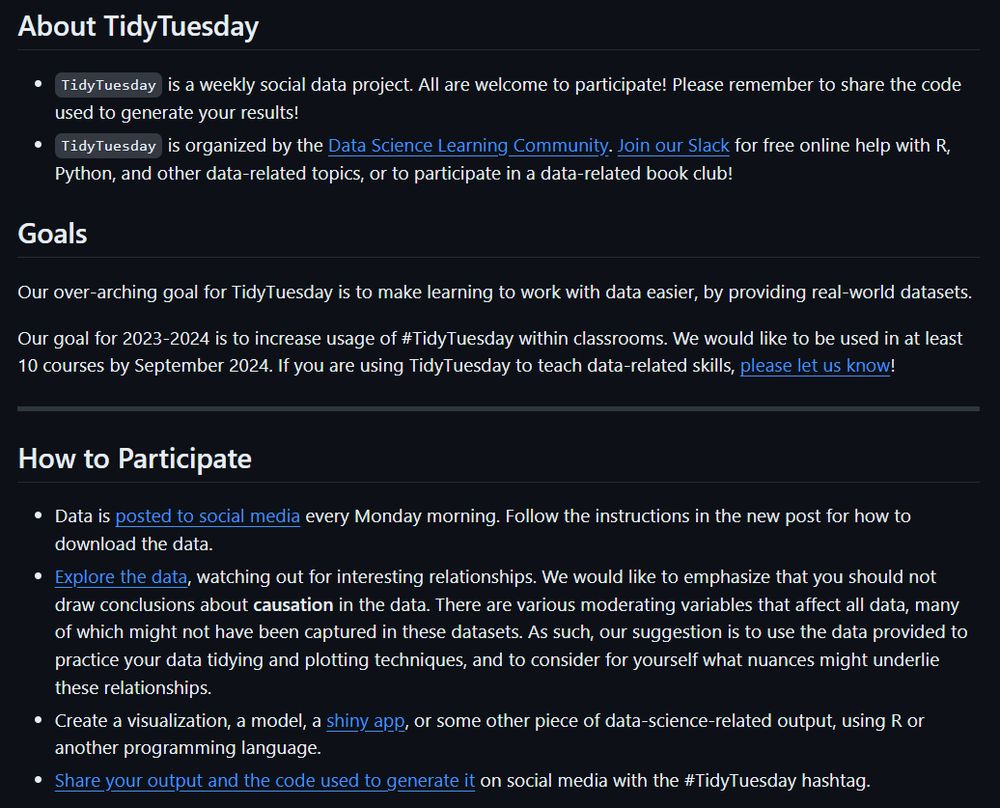
Logo for the #TidyTuesday Project. The words TidyTuesday, A weekly data project from the Data Science Learning Community (dslc.io) overlaying a black paint splash. TidyTuesday is a weekly social data project. All are welcome to participate! Please remember to share the code used to generate your results!
TidyTuesday is organized by the Data Science Learning Community. Join our Slack for free online help with R and other data-related topics, or to participate in a data-related book club!

 How to Participate
Data is posted to social media every Monday morning. Follow the instructions in the new post for how to download the data.
Explore the data, watching out for interesting relationships. We would like to emphasize that you should not draw conclusions about causation in the data.
Create a visualization, a model, a shiny app, or some other piece of data-science-related output, using R or another programming language.
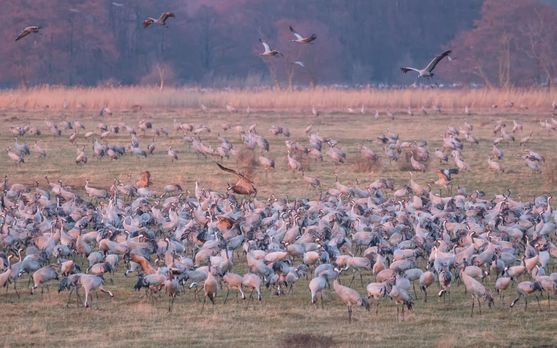
Share your output and the code used to generate it on social media with the #TidyTuesday hashtag. Large flock of cranes gathered in a grassy field during golden hour, with some birds in flight overhead and autumn-colored vegetation in the background.
Line chart showing the number of cranes per day at Lake Hornborga in Sweden during March and April from 2014-2021. Multiple gray lines represent different years, with the 2018 and 2021 seasons highlighted in blue. The chart shows crane migration patterns starting near zero in early March, building to peak numbers of 15,000-27,000 birds between March 30 and April 8 (highlighted in beige), then declining through late April. The highest recorded count was 27,300 cranes on April 3rd, 2019. Dashed lines indicate days when weather conditions made accurate counting difficult. A note explains that 2018 had unusually cold February temperatures causing later arrival. The chart is credited to Anna Thieme from Länsstyrelsen VG at https://transtat.lansstyrelsen.se/
Reposted by Frank Hull
tiddlydump.bsky.social
Use splines (and a bunch of human effort) you cowards!
frankiethull.bsky.social
LOL

I am also testing a linear method with cv to tune spline knots in a recipe step. There's another person on team saying MARS this bagged MARS that.

I hear the word spline at least once a day 🥴
frankiethull.bsky.social
I stepped away from the decomposition_model this week and built a spin off so we can use parsnip, ML engines, & xregs for the decomposition pieces and add those back together 🤘🏻
frankiethull.bsky.social
plotly::ggplotly is all you need
Reposted by Frank Hull
weare.rladies.org
ggplot v4.0.0 is now out! 🎉

Join the release party on October 3rd with developer & maintainer @teunbrand.bsky.social and the ggplot2 extenders meetup to learn all about what's new and the change-making process!

📅 Friday, Oct 3rd
🕐 3pm Eastern
📋 Sign up: bit.ly/join-gg-extenders

#RStats
Release party for ggplot2 v4.0.0
Friday October 3rd, 3pm Eastern
Taylor Swift holding up an album
frankiethull.bsky.social
I came across this in the wild a few days ago:
www.spsanderson.com/healthyR.ts/...

Really slick & thought I recognized your name 🧐 Been meaning to say thank you!
Using Tidy FFT
www.spsanderson.com
Reposted by Frank Hull
spsanderson.com
Now using the hai_data_scale() fns from healthyR.ai

Reference: www.spsanderson.com/healthyR.ai/...

#R #Rstats #tidydata #sttistics #data #normalization
Now using the hai_data_scale() fns from healthyR.ai

Reference: https://www.spsanderson.com/healthyR.ai/reference/hai_data_scale.html

#R #Rstats #tidydata #sttistics #data #normalization  Now using the hai_data_scale() fns from healthyR.ai

Reference: https://www.spsanderson.com/healthyR.ai/reference/hai_data_scale.html

#R #Rstats #tidydata #sttistics #data #normalization  Now using the hai_data_scale() fns from healthyR.ai

Reference: https://www.spsanderson.com/healthyR.ai/reference/hai_data_scale.html

#R #Rstats #tidydata #sttistics #data #normalization  Now using the hai_data_scale() fns from healthyR.ai

Reference: https://www.spsanderson.com/healthyR.ai/reference/hai_data_scale.html

#R #Rstats #tidydata #sttistics #data #normalization
frankiethull.bsky.social
Can you self-register tools to 1) create a new bsky account called frankiethuLLM, 2) fine-tune a new bot on my posts, a bot that you moderate, & 3) have bot post throughout the day so we can compare frankiethull vs frankiethuLLM
frankiethull.bsky.social
Most likely yes.

I'll do something like this but with many data frames:

train_data |>
ggplot() +
geom_line(aes(x = t, y = truth)) +
geom_line(
inherit.aes = FALSE,
data = test_data,
aes(x = t, y = .pred))
frankiethull.bsky.social
Added a handful of features to quark last night as well as a logo ⚛️

The logo is made from multiple Gemini concepts reworked with nano banana 🍌

Next step is building an app ✨

github.com/frankiethull...
GitHub - frankiethull/quark: agentic automl
agentic automl. Contribute to frankiethull/quark development by creating an account on GitHub.
github.com