
Joe DeCarolis
@jfdecarolis.bsky.social
9K followers
240 following
120 posts
Focused on applying state-of-the-art data systems, models, and analysis to inform decision making on energy. Professor at NC State University; served as the 10th Administrator of the U.S. Energy Information Administration. Personal account.
Posts
Media
Videos
Starter Packs

Reposted by Joe DeCarolis


Reposted by Joe DeCarolis


Reposted by Joe DeCarolis
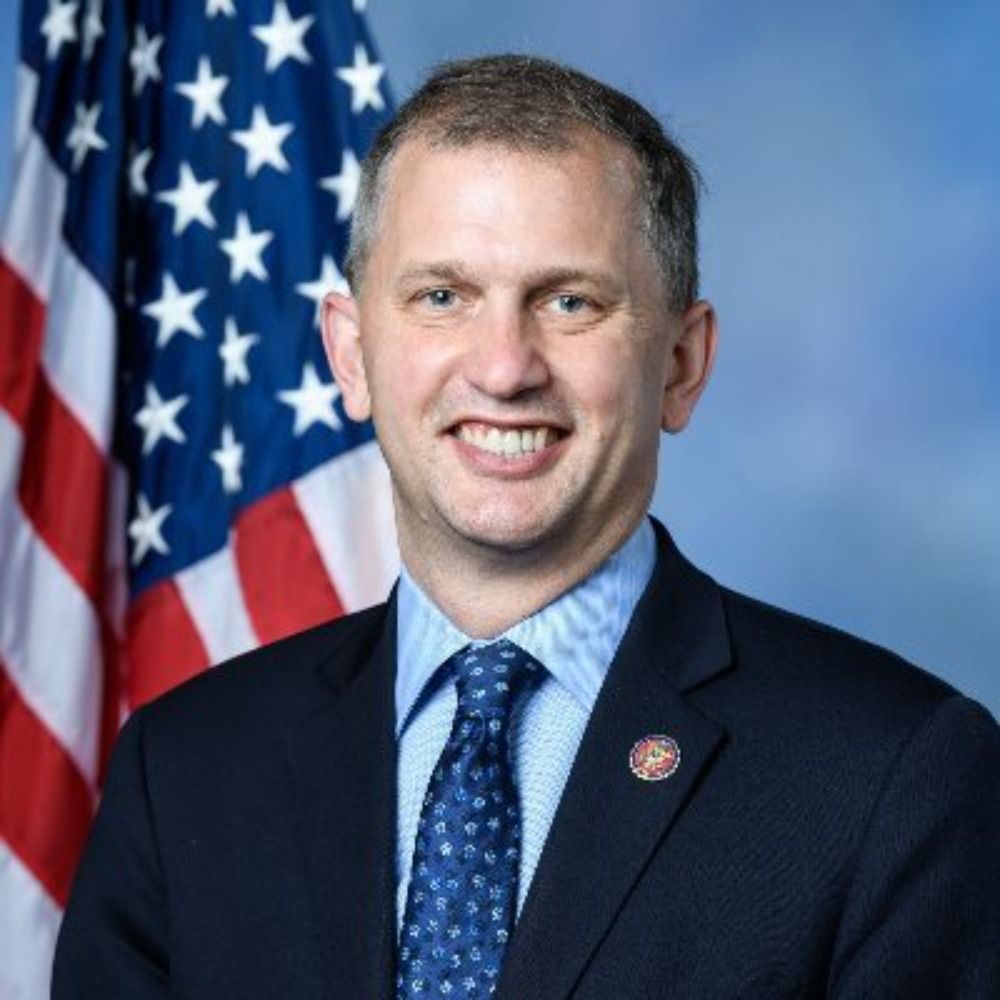
Rep. Sean Casten
@casten.house.gov
· Apr 30
Over 100 employees leave US EIA, putting crucial energy data at risk, sources say
The U.S. government's energy statistics arm is set to lose over 100 employees after the Trump administration's latest round of resignation offers, putting at risk some of the most closely watched energy reports globally, three sources told Reuters.
www.reuters.com

Joe DeCarolis
@jfdecarolis.bsky.social
· Apr 18


Joe DeCarolis
@jfdecarolis.bsky.social
· Apr 17
Joe DeCarolis
@jfdecarolis.bsky.social
· Apr 17

Joe DeCarolis
@jfdecarolis.bsky.social
· Apr 17


Joe DeCarolis
@jfdecarolis.bsky.social
· Apr 17

Joe DeCarolis
@jfdecarolis.bsky.social
· Apr 17