Justin Waraniak
@marathon-rana.bsky.social
370 followers 520 following 57 posts
Molecular ecologist, focusing on landscape genetics and conservation of freshwater ecosystems. Postdoctoral Researcher, PA Fish & Wildlife Co-op at Penn State he/him/they/them Digital illustrator: www.marathonrana.com (Commissions Open)
Posts Media Videos Starter Packs
marathon-rana.bsky.social
Happy Pride! The diversity of life, in all its forms, is pretty rad!

(Side note: there's not a whole lot of purple fish, so the pink/silver goldeye is the best I got)

#SundayFishSketch #Pride
Six fish arrayed diagonally over the top of a rainbow pride flag. At the top left on the red stripe is a northern redbelly dace (Chrosomus eos), on orange is a male rainbow darter (Etheostoma caeruleum), a shorthead redhorse (Moxostoma macrolepidotum) on the yellow stripe, a northern pike (Esox lucius) for the green stripe, an orangespotted sunfish (Lepomis humilus) on the blue strip and a goldeye (Hiodon alosoides) on the purple stripe.
Reposted by Justin Waraniak
jacsciart.bsky.social
I've been camping almost every weekend as of late so haven't been able to post #SundayFishSketch, but here is an edited version of my Rainbow Trout illustration with altered coloring in honor of #PrideMonth.
An illustration of a Rainbow Trout, but instead of the realistic coloring on the body, the colors make a rainbow in honor of Pride month.
marathon-rana.bsky.social
2) Lipids acted as a mediating factor so that fish could maintain reproductive allocation in the presence of parasites, but this came at a cost of lower lipid stores in heavily parasitized fish.

🧵(3/3)
Relationships between lipids as a proportion of dry weight and some of the most important variables that explained variation in lipid content of Cyprinodon tularosa, including the presence of yolked eggs (panel A), gonadosomatic index (GSI, panel B), and parasite density (panel C). Fish with yolked eggs had lower proportions of lipids. Lipid proportions were also negatively correlated with GSI and parasite density
marathon-rana.bsky.social
1) Life history traits did not differ much among populations, despite the fact that they occupy very different habitats and have developed very different body shapes.

🧵(2/3)
Redundancy analysis biplot showing associations between variation in life history traits (black labels) and parasite counts (red labels with arrows) for the two most important redundancy analysis axes, accounting for 6.41% and 0.71% of the total variation in life history traits respectively. Individuals are depicted as colored points and 80% confidence interval ellipses are drawn for each population to show the similarity of typical RDA scores among the four populations. All four ellipses have roughly the same center near the origin of the plot and are mostly overlapping. The position of the labels for the life history dependent variables (in black) and the constrained parasite count variables (in red with arrows) indicates the strength and direction of association each variable has with the respective RDA axis. Gonadosomatic index, condition factor, age, wet weight, and length are all along one side of the x-axis, in that order increasing in intensity, and lipid content and dry weight are in the opposite direction. All four of the types of parasites (Gill, Liver, Eye, and Mesentery) are pointed in the same direction as the GSI, Age, Length, etc., indicating that the parasite loads may be positively correlated with those factors and negatively correlated with lipids and dry weight.
marathon-rana.bsky.social
I have a new paper out in Environmental Biology of Fishes on the effects of parasites on the life history of White Sands Pupfish! The two main findings being:

🧵(1/3)

rdcu.be/eptDZ
Life history trade-offs mediated by digene parasites in the protected White Sands pupfish (Cyprinodon tularosa)
rdcu.be
marathon-rana.bsky.social
I've only ever ordered stickers; pins would be fun though!
marathon-rana.bsky.social
To celebrate the start of Pride Month, here are some Pride rainbow trout! Happy Pride everyone! #SundayFishSketch
Digital illustration of a rainbow trout, recolored with the colors of the bi pride flag, with dark blue on top, pink along the side, and deep magenta along the belly. Digital illustration of a rainbow trout recolored with the colors of the trans pride flag with light blue along the top and belly, pink along the sides, and a white stripe along the lateral line. Digital illustration of a rainbow trout recolored with the colors of the lesbian pride flag with oranges along the top, purples along the belly, and a white stripe along the lateral line.
marathon-rana.bsky.social
A little late, but finished a least darter for #SundayFishSketch! The mating displays of this species may not be as intense as some other darters, but males of this species still develop bright red blotches on their fins!
Digital illustration of a breeding male least darter (Etheostoma microperca). This fish has a long oval-shaped body with a nearly rectangular tail that accounts for about a third of the length. It has a small mouth and dark stripes crossing the eye, one going from the top of the gill cover horizontally across the eye to the snout, the other starting just above the eye and continuing down across the cheek. It has two dorsal fins, the first spiny with sharp bony spines, the second soft supported by fan-like bony filaments. The tail fin is fan-shaped with no fork or distinct lobes. The anal fin has two sharp spines in the front before more soft rays arcing behind to make the rest of the fin. The pectoral and pelvic fins are large and very close together near the gill cover. The body is a mottled green-yellow color with dark brown splotches along the midline. There are bright red splotches on fin membrane between the rays of the first dorsal fin, pelvic fins, and anal fin.
marathon-rana.bsky.social
That's a nice sketch! The nuchal hump is a mating display on male peacock bass and other cichlids.

Also, this is a pet peeve, but animals don't have genders - sex is the technically correct term.
Reposted by Justin Waraniak
drkatfish.bsky.social
Today (May 19) is the final day to provide comments on the Endangered Species Act rule change - here's some info about how to submit a comment: esa.org/esablog/2025...
marathon-rana.bsky.social
Some old art of the Quitobaquito pupfish, an endangered species endemic to Organ Pipe Cactus National Monument and the Sonoyata River along the Arizona-Mexico border! #SundayFishSketch #CincoDeMayo
A digital illustration of a Quitobaquito pupfish (Cyprinodon eremus). This fish has a large head with a small mouth and a short, stout body. It has one trapezoidal dorsal fin along its back. The tail is very stout and the tail fin is shaped like a pentagon. There are small pectoral, pelvic, and anal fins along the fish's underside. This fish is bright blue in color with four darker teal bars along its back and a yellowish splotch on the upper side of the tail. The Mexican flag is in the background.
marathon-rana.bsky.social
A johnny (the Baptist?) darter for this week's Easter-themed #SundayFishSketch! I was out doing some stream sampling this week and the darters were all colored up in their breeding colors, one of the surest signs of spring!
Digital illustrations of johnny darters, with the male breeding pattern shown in the upper left and the normal coloration in the bottom right. These fish have long cylindrical bodies and somewhat froglike faces with relatively small mouths and a gill cover that comes to a sharp point. They have two large dorsal fins along the back, the first with bony spines and the second with soft rays. The tail is fan-shaped and has no fork. The pectoral and pelvic fins are large and shaped like leaves. The breeding male has a dark grey head and belly, has dark stripes along the side of the body, and has dark grey fins with light colored rays and lots of dark spots. The normal coloration is more uniformly light brown with some small dark saddles on the back, markings in the shape of w's and x's along the side, and light colored fins with sparser spots. Both color morphs have a dark teardrop marking under the eye.
Reposted by Justin Waraniak
jacsciart.bsky.social
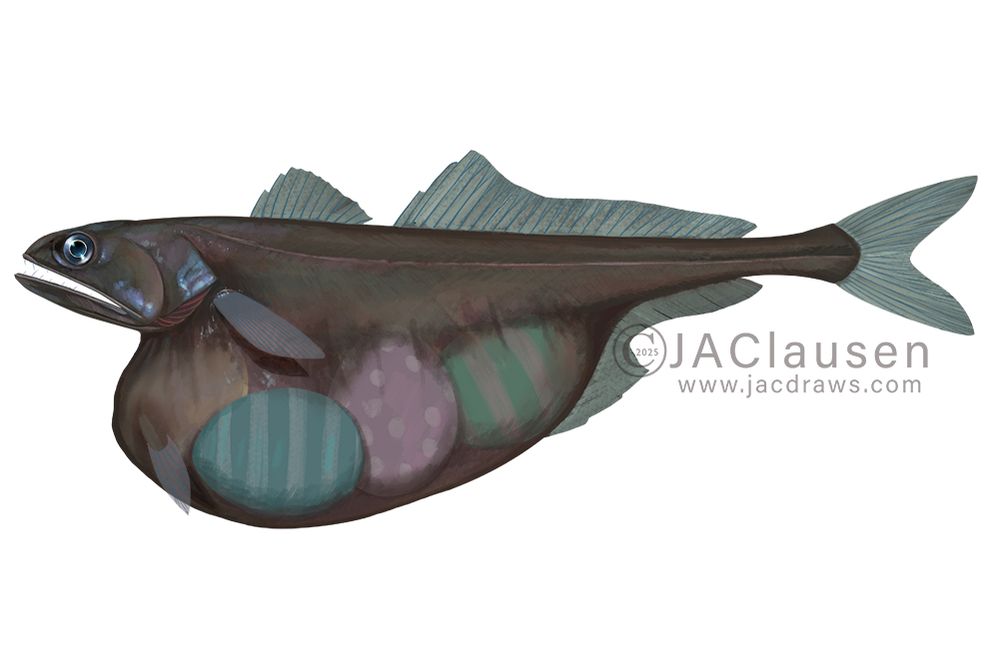
Have been working on an illustration of Chiasmodon niger and decided to modify it a bit to fit today's #SundayFishSketch theme.
An in progress illustration of a Black Swallower fish. This fish lives in the deep sea and is brown to black in color with a long, thin body. It has a pretty large eye and very large mouth that leads to a stomach that can extend to several times its regular size, sometimes even becoming partly transparent. This allows the fish to eat prey larger than itself. In this illustration, I added some colorful Easter eggs in its stomach to fit with the Sunday Fish Sketch theme.
Reposted by Justin Waraniak
jacsciart.bsky.social
The finished illustration of a Devil's Hole Pupfish.

#SciArt
An illustration of a Devil's Hole Pupfish. The fish is facing the left. The scales are a brown ochre color near the top of the fish, but are a sky blue along the sides, fading to a more cream color along the belly. Just below the eye, the coloring is more purple and pink, with some blue. The fins are almost white (supposed to represent clear) in color, but each has a black margin.
marathon-rana.bsky.social
I feel like winter ice fishing is the prime season for catching burbot, and I live in the wrong part of the country to catch them now, but I always thought the eelpout festival in Minnesota looked kind of fun! #SundayFishSketch
Digital illustration of a burbot (Lota lota). This is a long eely fish closely related to cod. It has one long barbel on its chin. It has a small eye and a short, stout head. There are two dorsal fins on its back, the first short and roughly square shaped, and the second equal in height, but about four times as long. The anal fin is almost a direct mirror of the second long dorsal fin, just on the bottom side of the fish. The tail fin is comparatively small and round in shape. The pelvic fins and pectoral fins are similarly shaped, very close together, and positioned just behind the gill cover. The body of the fish is covered in tiny scales that are barely visible. The belly of the fish is a light cream in color, while the top side and the fins are covered in yellowish-orange splotches on a mottled dark brown background.
Reposted by Justin Waraniak
liseviollat.bsky.social
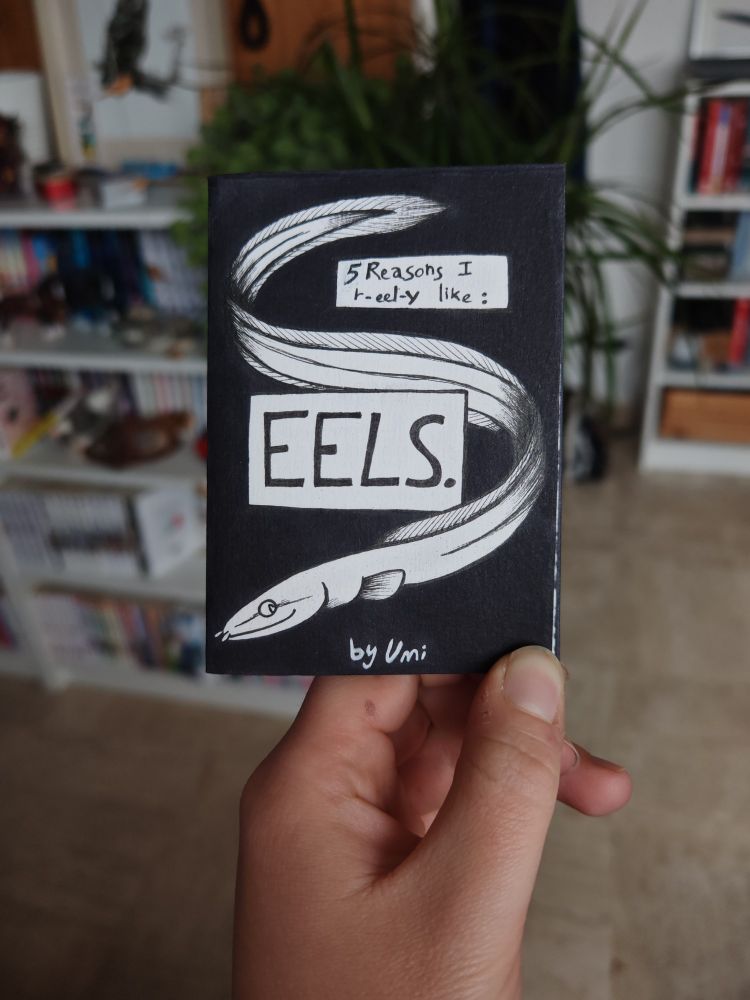
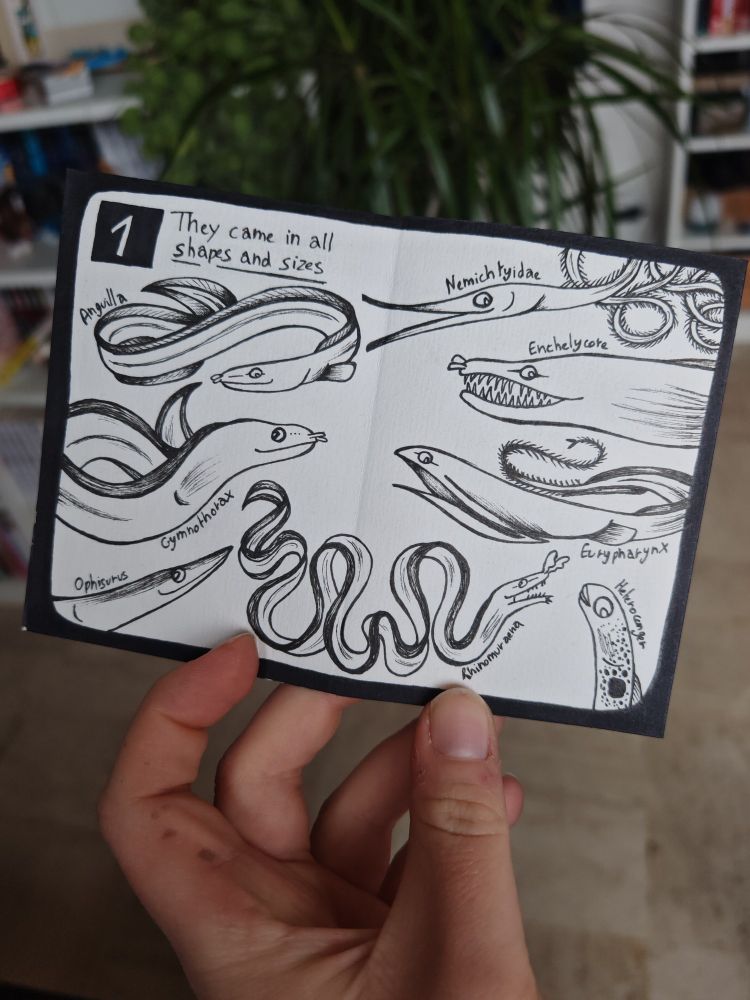
I made a little mini zine about eels hehehe
#sundayfishsketch
Reposted by Justin Waraniak
jasonkeagy.bsky.social
This is a bit delayed because I’ve been distracted by the world going to shit, but…

We published a paper that I am so very excited about: doi.org/10.1016/j.sc...

In this study we tracked brook trout response to heat waves in nature using gene expression from non-lethal gill biopsies. (1/n)
Redirecting
doi.org
marathon-rana.bsky.social
It was the trout season opener this weekend in Pennsylvania, so to celebrate here's a brown trout! #SundayFishSketch
Digital illustration of a brown trout (Salmo trutta). This fish has a torpedo-shaped body with a large mouth. The lower jaw is longer than the upper jaw. It has one rectangular dorsal fin and a small round adipose fin on its back. The tail is wide and very slightly forked. The body is brown with some orange and yellow highlights and is covered in dark red and brown spots of varying sizes, some with light colored outlines. The whole body is covered in very small scales.
marathon-rana.bsky.social
Inking some spots for the next fish I'm working on. Any guesses on who they belong to?

#SundayFishSketch #WIP
Closeup of a work in progress digital illustration of a fish. The close-up only shows the side of the fish, with no fins or parts of the head visible. The field of the fish's body is an orange-brown, darker on top with a brighter yellow cream color on the bottom. There are also tons of spots, some larger brownish-red ones with light colored outlines, smaller densely packed dark grey spots, and even smaller sparse bright red spots.
marathon-rana.bsky.social
We found specific genes that vary with temperature. As we learn how these genes vary across populations and environmental conditions, we can use them to find fish that are particularly stressed by heat or may be most able to adapt to future climate conditions! (5/5)
A collection of graphs showing how expression of four genes, a cold-shock protein (AN32B, top), a heat-shock protein (HSP47, 2nd row), a splicing factor (TRA2B, 3rd row) and a ubiquitinase (USP9X, bottom) co-varied with temperature. The leftmost graphs show scatterplots of expression versus temperature with lines of best fit, all color coded by stream. The graphs for the cold shock protein shows expression decreased log-linearly with temperature, increased linearly for the heat shock protein, and expression of the splicing factor formed a curve that dipped around 18ºC, but had similar levels of expression at higher and lower temperatures. These three genes showed similar expression in all four streams, but the scatterplot for the ubiquitinase shows a situation where the expression did increase along with temperature in each stream, but all the streams have different levels of expression even when they are at the same temperature. The right side of the figure four graphs through time for each gene, comparing the temperature (dotted line) and gene expression (big circles with arrows) in each stream during the study period.
marathon-rana.bsky.social
...which lets us compare the paths that gene expression takes through time in each stream. All the streams followed similar paths, especially during the second heatwave when changes in gene expression were the most pronounced. (4/5)
marathon-rana.bsky.social
We used TagSeq to quantify the relative amounts of different mRNAs. Because we sampled the same streams multiple times, we could track how the composition of genes being expressed changed with temperature. We tracked these changes using a trajectory analysis... (3/5)
Graph of a trajectory analysis. The x and y axis are labeled as principal component 1 and 2 respectively. These are composite variables constructed by linear combinations of gene expression data that vary most across the time points and streams. The axis labels also say what biological processes and molecular functions are most related to each part of the axes. The left side of the x-axis is most heavily influenced by genes that make up ribosomal components, there were no clear functions associated with the right side of the x-axis. The low values of the y-axis are driven by expression of genes involved in oxygen carrier activity and the upper values are driven by immune response genes. The graph itself is a scatterplot, with points representing the gene expression of each individual fish sampled, color coded by stream. There are also four sets of numbers (1-8) plotted along with the points showing the average expression across individuals from the same stream for each sample date. The numbers are connected in sequence by arrows, drawing the "paths" gene expression makes in each stream through the two heatwaves. The paths the four streams make are pretty similar, mostly moving along a diagonal with a negative slope. The path segments for most streams tend to be quite short for time points 1-4, but get longer during the second heatwave time points 5-8. The exception to this is East Branch, where the path segments are comparatively long during both the first and second heatwaves.