Mark SubbaRao
@marksubbarao.bsky.social
720 followers 590 following 110 posts
NASA's Scientific Visualization Studio Lead Data Viz . Climate . Astronomy . Food I'll try and keep my opinions to myself but when I inevitably slip up please remember that they are my own. https://marksubbarao.science/
Posts Media Videos Starter Packs
Reposted by Mark SubbaRao
drkatemarvel.bsky.social
my takeaway from climate week nyc is that "climate storytelling" is a little too much "we must reimagine our deepest souls in relationship to mother nature and the moral abyss of the polycrisis into which we must now stare" and not enough "ok but get a heat pump"
marksubbarao.bsky.social
The different sources of atmospheric methane: svs.gsfc.nasa.gov/5424 a companion to the popular SVS visualization of carbon dioxide from 2023: svs.gsfc.nasa.gov/5110
Reposted by Mark SubbaRao
marksubbarao.bsky.social
Atmospheric Carbon Dioxide Concentration
800,000 BCE - July 2025
svs.gsfc.nasa.gov/5447/
marksubbarao.bsky.social
This newly released visualization showing the progression of the Palisades and Eaton fires was the last visualization produced by the SVS's Cindy Starr after an incredible 37 year career.
svs.gsfc.nasa.gov/5558/
marksubbarao.bsky.social
August 1-September 15, 2024

Sorry that it is hard to find. It is listed in the dataset section, but we will make sure it gets bumped up to the main text as well.
Reposted by Mark SubbaRao
ravenscimaven.bsky.social
NASA is more than rockets and moonwalks. NASA is behind much of our everyday technology. From space discovery, to Air Jordans, to CAT scans, NASA has played a role. We get it all on less than a penny of every federal dollar. Now their science may be gutted by 50%.
#NASADidThat
Reposted by Mark SubbaRao
nuphoto.com
A few tips:

1: Open up your aperture as much as you can for more bokeh. Faster lenses are better.

2: Make a mark on your focus ring + lens (I use two narrow strips of masking tape) so you can quickly and repeatedly hit your in-focus point.
Reposted by Mark SubbaRao
davidho.bsky.social
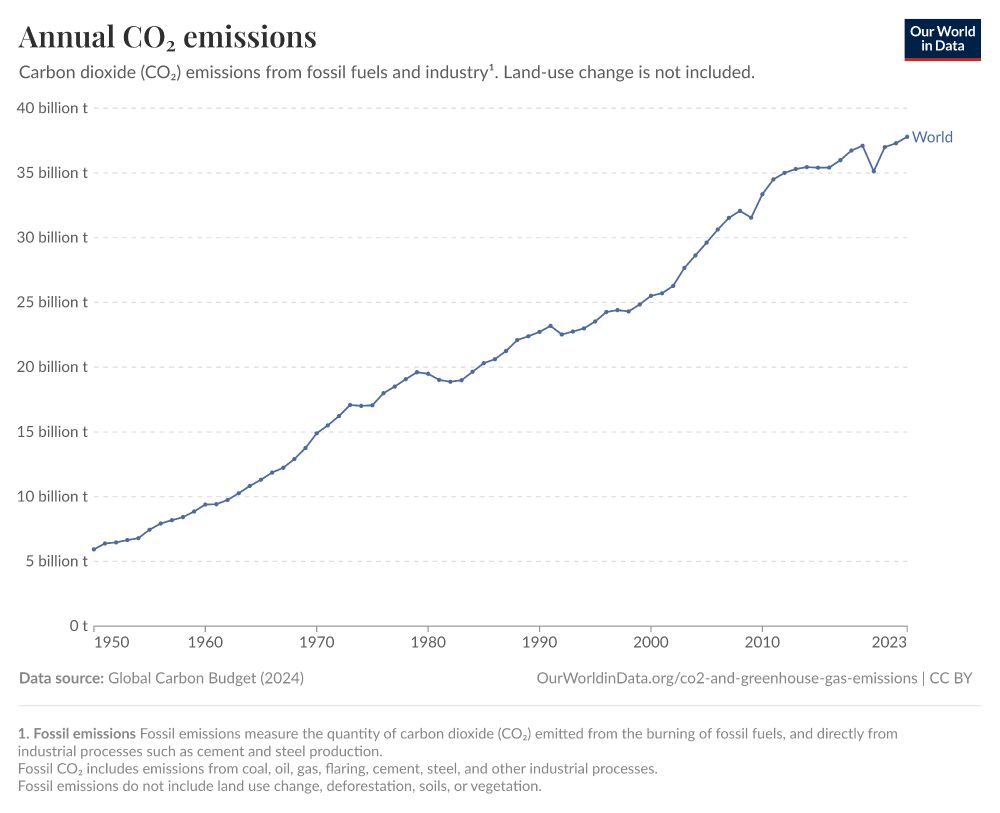
I get annoyed at the narrative that all the awareness and work on climate change hasn't done anything. Yes, global CO₂ emissions indeed continue to climb, but we don't know the counterfactual. When I was in grad school, we were on track for 5°C of warming. Now it's below 3°C. That's progress.
A line chart titled “Annual CO₂ emissions” shows the global carbon dioxide emissions from fossil fuels and industry from 1950 to 2023. The y-axis represents emissions in billions of tonnes (t), ranging from 0 to 40 billion t. The x-axis covers the years from 1950 to 2023.

The chart presents a steady increase in emissions from approximately 5 billion tonnes in 1950 to over 36 billion tonnes in 2023. Key features include:

A consistent upward trend from 1950 through the early 1970s.

A brief plateau and dip around 1980–1983.

A strong growth trend resuming in the late 1980s.

A sharp increase during the 2000s.

A slight drop around 2008–2009, likely due to the global financial crisis.

A major dip in 2020, attributed to the COVID-19 pandemic.

A rapid rebound in emissions after 2020, continuing the upward trend to a new high in 2023.

A blue line labeled “World” traces these changes over time.

Below the chart, the data source is listed as the Global Carbon Budget (2024), and the graphic is credited to OurWorldInData.org with a Creative Commons license (CC BY). A footnote explains that the data includes emissions from coal, oil, gas, flaring, cement, and steel, but excludes land-use changes such as deforestation.
Reposted by Mark SubbaRao
stsci.edu
The core portion of the Nancy Grace Roman Space Telescope has successfully completed vibration testing, ensuring it will withstand the extreme shaking experienced during launch: go.nasa.gov/4jNWjcK 🔭 🧪
Reposted by Mark SubbaRao
robertpicardo.bsky.social
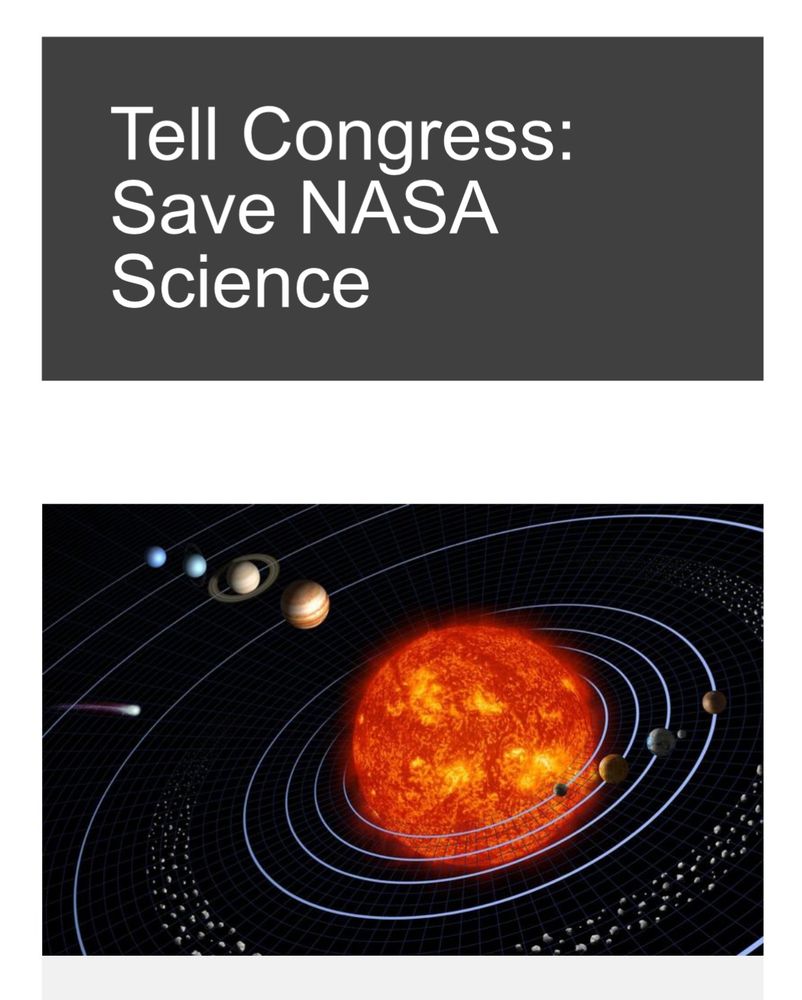
NASA is our best US brand name. Proposed cuts to NASA will destroy our position of leadership in space science and exploration ! Tell Congress: Save NASA Science congressweb.com/PlanetarySocie… #
Reposted by Mark SubbaRao
rachelbc.bsky.social
Meteorologists across the country should be adapting this messaging locally for their regional forecast needs…
johnmoralestv.bsky.social
Cuts have consequences, illustrated. As seen on TV 📺
Reposted by Mark SubbaRao
climateofgavin.bsky.social
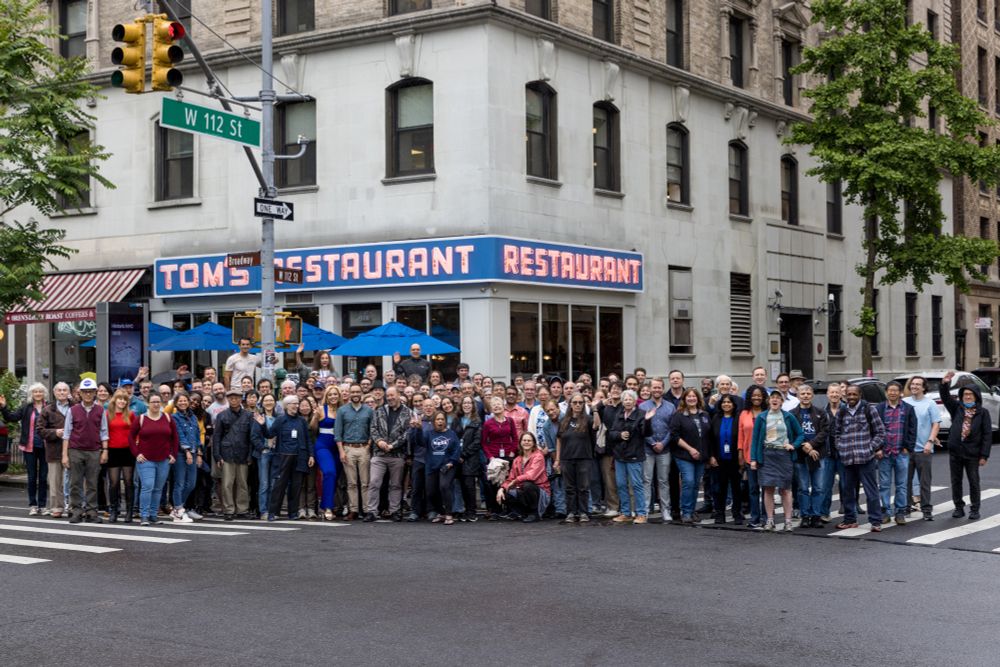
Last day at the GISS building (Wed. May 28th). 🥲
Photo of the a large group of GISS employees/colleagues in front of Toms Restaurant with a prominent street sign saying "112th St" taken from the middle of Broadway. Credit: Tricia Baron.
Reposted by Mark SubbaRao
cosmicrami.com
Let’s make today (May 10) Magnetosphere Appreciation Day!

A year ago today we had that huge aurora display, caused by the most powerful geomagnetic storm experienced in decades.

Lovely visualisations by NASA SVS/NASA DRIVE science centre on how our atmosphere and magnetosphere responded.

🧪🔭☀️🧲
Reposted by Mark SubbaRao
zacklabe.com
As summer in the Northern Hemisphere approaches, it is important to keep in mind how temperatures are changing 🌡️

Shifting distribution to the right ➡️ increasing societal risks from extreme heat

The driver? Humans... The burning of fossil fuels

Visualization created by NASA svs.gsfc.nasa.gov/5452/
marksubbarao.bsky.social
Upsetting news today about the lease on the GISS building being cancelled. Solidarity with my GISS colleagues who do important work on food security, agriculture, exoplanets, and education in addition to their groundbreaking climate modelling.
marksubbarao.bsky.social
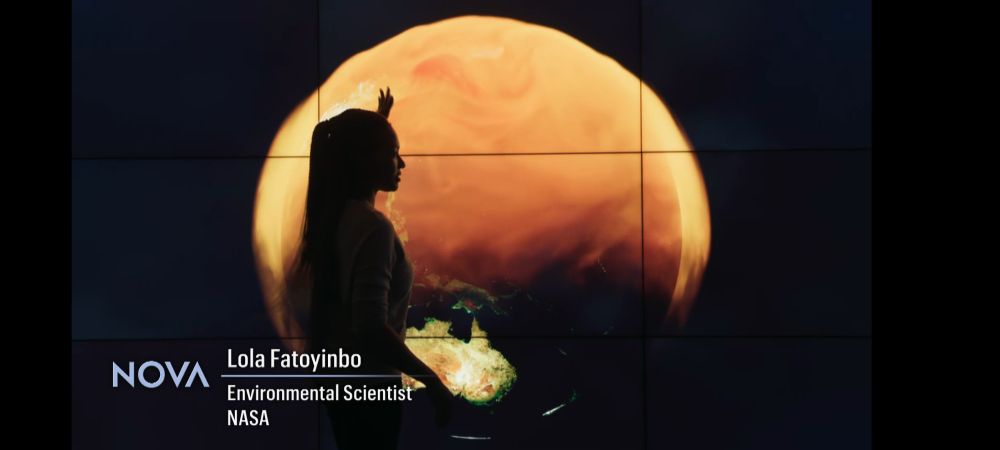
@novapbs.bsky.social premiered 'Secrets of the Forest' today. At the 5 minute mark Goddard's Lola Fatoyinbo shows off an SVS visualization of CO2 in front of our hyperwall. www.pbs.org/wgbh/nova/vi...
Lola Fatoyinbo in front of a visualization of Global Carbon Dioxide shown in orange playing on a large tiled display.