


Marco Cortella
@mcx83.bsky.social
📊 #BI and #dataViz Consultant |
😱 #horrorchart collector |
💡Insights & Data @Capgemini | socio @ondatait.bsky.social
Torino, Italy.
😱 #horrorchart collector |
💡Insights & Data @Capgemini | socio @ondatait.bsky.social
Torino, Italy.
Italian #opendata legends @aborruso.bsky.social and @giorgialodi.bsky.social
now at #csvconfv9 talking about 15 years of Open data in Italy.
@csvconf.bsky.social
now at #csvconfv9 talking about 15 years of Open data in Italy.
@csvconf.bsky.social

September 11, 2025 at 11:23 AM
Italian #opendata legends @aborruso.bsky.social and @giorgialodi.bsky.social
now at #csvconfv9 talking about 15 years of Open data in Italy.
@csvconf.bsky.social
now at #csvconfv9 talking about 15 years of Open data in Italy.
@csvconf.bsky.social
Nice to be in Bologna today for #csvconfv9 and starting with a talk by @rahulbot.bsky.social!
@csvconf.bsky.social
@csvconf.bsky.social
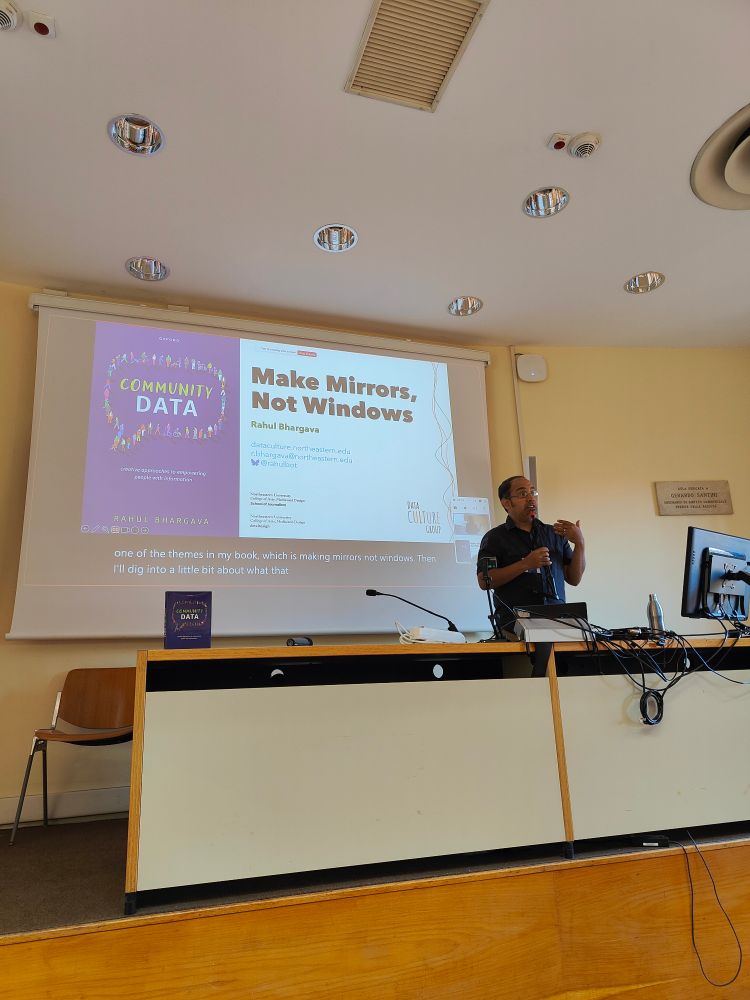
September 11, 2025 at 8:33 AM
Nice to be in Bologna today for #csvconfv9 and starting with a talk by @rahulbot.bsky.social!
@csvconf.bsky.social
@csvconf.bsky.social
After the #GPT5 chart failure, I also discovered that Anthropic is promoting benchmark increases with... a truncated y-axis bar chart.
#dataviz #horrorchart
#dataviz #horrorchart
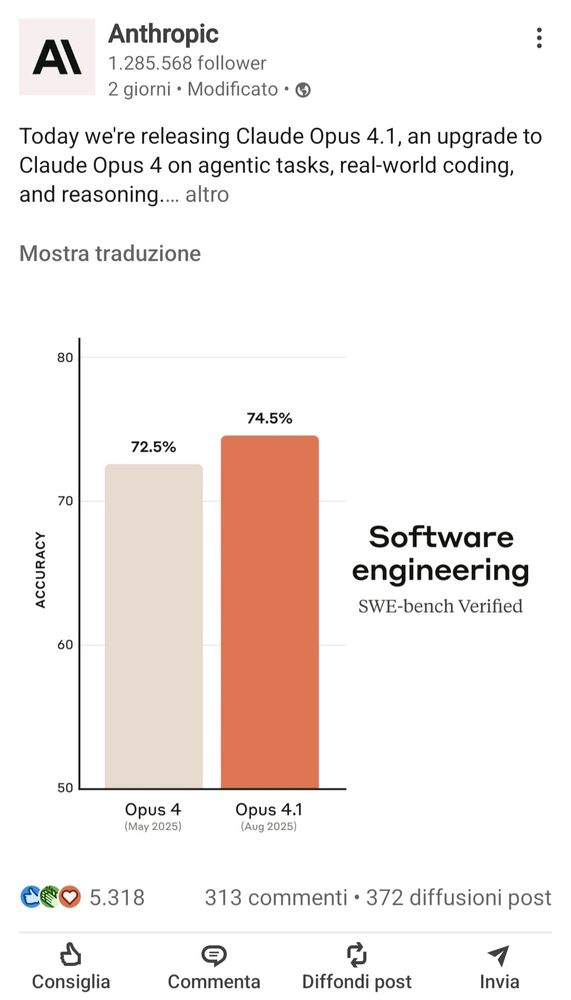
August 8, 2025 at 7:04 AM
After the #GPT5 chart failure, I also discovered that Anthropic is promoting benchmark increases with... a truncated y-axis bar chart.
#dataviz #horrorchart
#dataviz #horrorchart
Just a reminder: #dataviz isn't intrinsically good or bad. Like other forms of communication, it can -and will- be used for propaganda as well.
By the way, the photo is from 2012.
By the way, the photo is from 2012.

June 19, 2025 at 7:56 AM
Just a reminder: #dataviz isn't intrinsically good or bad. Like other forms of communication, it can -and will- be used for propaganda as well.
By the way, the photo is from 2012.
By the way, the photo is from 2012.
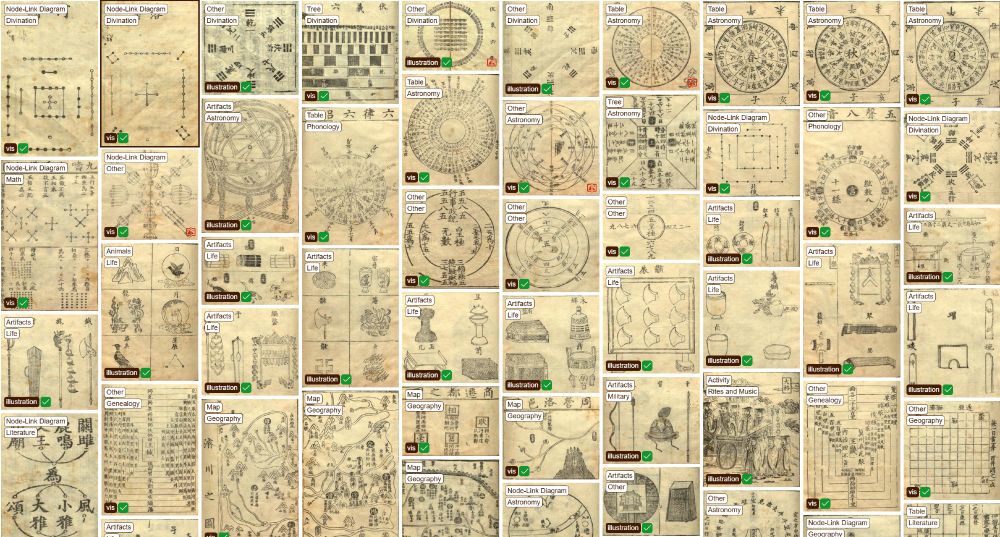
This collection of ancient Chinese visualizations deserves some of your time. It's another example that visualization isn't a Western world invention.
Thanks to @infowetrust.com for highlighting this gem.
zuantuset.github.io/gallery/#/
#dataviz
Thanks to @infowetrust.com for highlighting this gem.
zuantuset.github.io/gallery/#/
#dataviz
April 23, 2025 at 3:26 PM
This collection of ancient Chinese visualizations deserves some of your time. It's another example that visualization isn't a Western world invention.
Thanks to @infowetrust.com for highlighting this gem.
zuantuset.github.io/gallery/#/
#dataviz
Thanks to @infowetrust.com for highlighting this gem.
zuantuset.github.io/gallery/#/
#dataviz
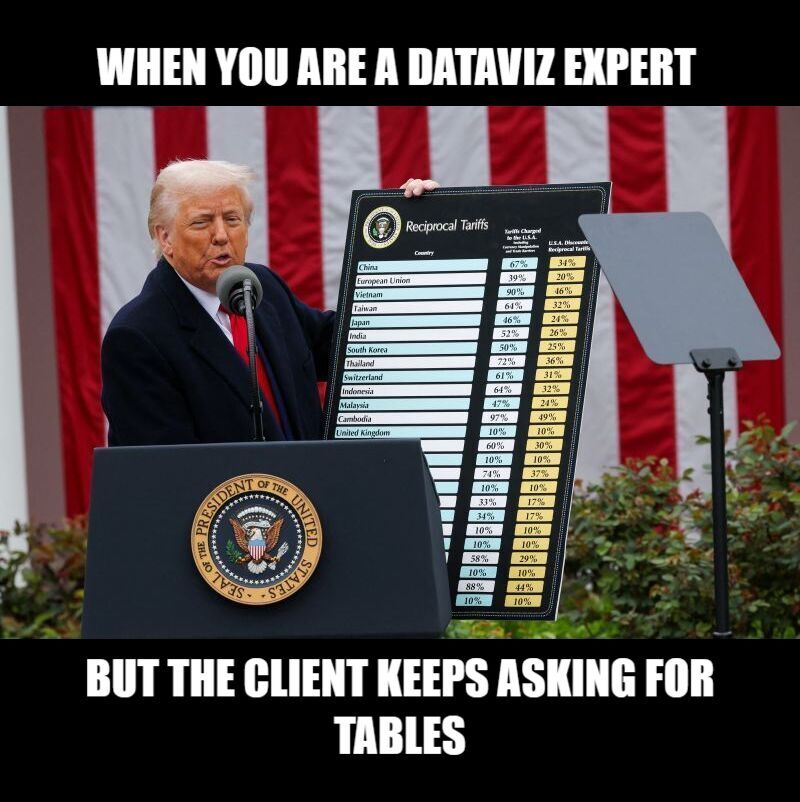
Trump announces new tariffs, but the communication choice is questionable: a big table full of numbers instead of a chart. Some tariffs even apply to uninhabited places. Always double-check data, even when it looks 'professional.'
h/t: @acotgreave.bsky.social
#dataviz
h/t: @acotgreave.bsky.social
#dataviz

April 3, 2025 at 7:44 AM
Trump announces new tariffs, but the communication choice is questionable: a big table full of numbers instead of a chart. Some tariffs even apply to uninhabited places. Always double-check data, even when it looks 'professional.'
h/t: @acotgreave.bsky.social
#dataviz
h/t: @acotgreave.bsky.social
#dataviz
📊Check out the Data Visualization Summer School (DVSS) at the University of Genoa, July 7-11, 2025! Led by @annalisabarla.bsky.social and Andrea Vian, with @ebertini.bsky.social as guest speaker, this hands-on program covers data visualization & GenAI.
More info: shorturl.at/oY96G
#dataviz
More info: shorturl.at/oY96G
#dataviz

March 31, 2025 at 8:07 AM
📊Check out the Data Visualization Summer School (DVSS) at the University of Genoa, July 7-11, 2025! Led by @annalisabarla.bsky.social and Andrea Vian, with @ebertini.bsky.social as guest speaker, this hands-on program covers data visualization & GenAI.
More info: shorturl.at/oY96G
#dataviz
More info: shorturl.at/oY96G
#dataviz
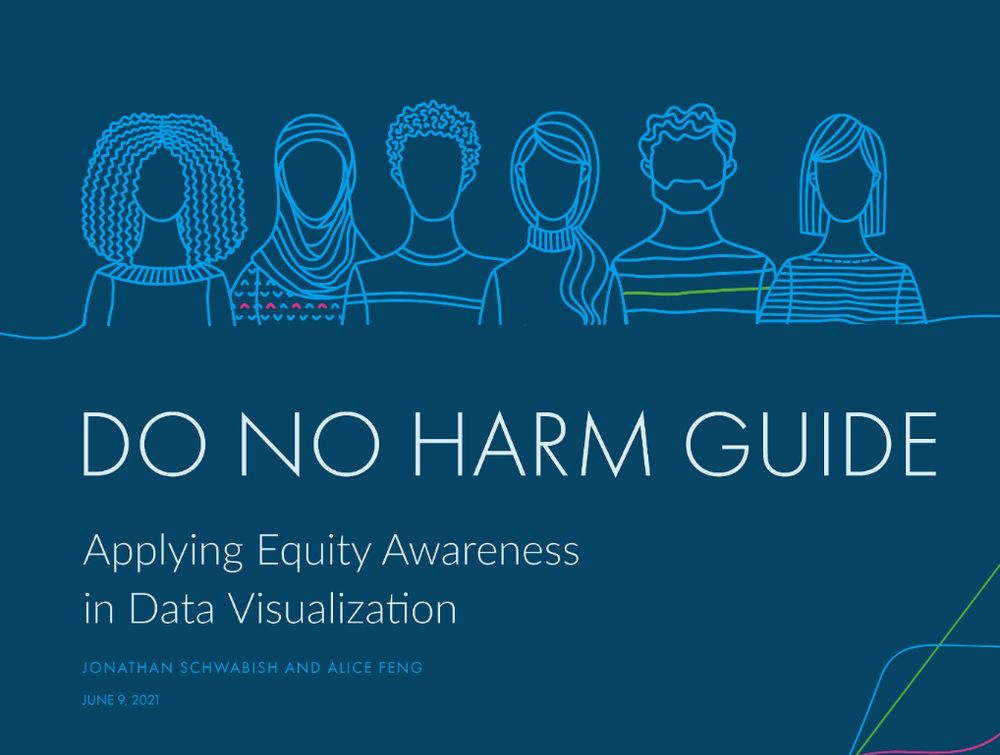
🌍 As DEI programs face setbacks, it’s crucial to rethink inclusive design. The Do No Harm Guide by @urbaninstitute.bsky.social goes beyond aesthetics, challenging us to communicate data with empathy and equity. A must-read for those working with data. 📊
🔗 www.urban.org/sites/defaul...
#dataviz
🔗 www.urban.org/sites/defaul...
#dataviz
March 11, 2025 at 6:41 PM
🌍 As DEI programs face setbacks, it’s crucial to rethink inclusive design. The Do No Harm Guide by @urbaninstitute.bsky.social goes beyond aesthetics, challenging us to communicate data with empathy and equity. A must-read for those working with data. 📊
🔗 www.urban.org/sites/defaul...
#dataviz
🔗 www.urban.org/sites/defaul...
#dataviz
📊 W.E.B. Du Bois and Data Visualization in the Fight for Civil Rights
In 1900, Du Bois created 60+ charts to illustrate Black Americans’ progress at the Paris Expo. The Du Bois Challenge 2025 invites participants to recreate them using modern tools.
📈 Join here: github.com/ajstarks/dub...
#dataviz
In 1900, Du Bois created 60+ charts to illustrate Black Americans’ progress at the Paris Expo. The Du Bois Challenge 2025 invites participants to recreate them using modern tools.
📈 Join here: github.com/ajstarks/dub...
#dataviz

February 4, 2025 at 7:55 AM
📊 W.E.B. Du Bois and Data Visualization in the Fight for Civil Rights
In 1900, Du Bois created 60+ charts to illustrate Black Americans’ progress at the Paris Expo. The Du Bois Challenge 2025 invites participants to recreate them using modern tools.
📈 Join here: github.com/ajstarks/dub...
#dataviz
In 1900, Du Bois created 60+ charts to illustrate Black Americans’ progress at the Paris Expo. The Du Bois Challenge 2025 invites participants to recreate them using modern tools.
📈 Join here: github.com/ajstarks/dub...
#dataviz
How big is a billion?
Matt Korostoff's "Wealth shown to scale" visualizes the vast fortunes of the world's richest, showing the gap in a powerful, simple way. Scroll through and feel the disparity.
➡️ Try it: mkorostoff.github.io/1-pixel-weal...
📍Note: Data from 2021.
#dataviz
Matt Korostoff's "Wealth shown to scale" visualizes the vast fortunes of the world's richest, showing the gap in a powerful, simple way. Scroll through and feel the disparity.
➡️ Try it: mkorostoff.github.io/1-pixel-weal...
📍Note: Data from 2021.
#dataviz
January 28, 2025 at 1:20 PM
How big is a billion?
Matt Korostoff's "Wealth shown to scale" visualizes the vast fortunes of the world's richest, showing the gap in a powerful, simple way. Scroll through and feel the disparity.
➡️ Try it: mkorostoff.github.io/1-pixel-weal...
📍Note: Data from 2021.
#dataviz
Matt Korostoff's "Wealth shown to scale" visualizes the vast fortunes of the world's richest, showing the gap in a powerful, simple way. Scroll through and feel the disparity.
➡️ Try it: mkorostoff.github.io/1-pixel-weal...
📍Note: Data from 2021.
#dataviz
How big is #Greenland really? 🌍
Maps often show Greenland as massive, almost as big as Africa. But in reality, Africa is 14x larger! This distortion comes from the Mercator projection, which enlarges areas near the poles.
You can see how it really look like on www.thetruesize.com
#maps #dataviz
Maps often show Greenland as massive, almost as big as Africa. But in reality, Africa is 14x larger! This distortion comes from the Mercator projection, which enlarges areas near the poles.
You can see how it really look like on www.thetruesize.com
#maps #dataviz
January 9, 2025 at 8:36 AM
How big is #Greenland really? 🌍
Maps often show Greenland as massive, almost as big as Africa. But in reality, Africa is 14x larger! This distortion comes from the Mercator projection, which enlarges areas near the poles.
You can see how it really look like on www.thetruesize.com
#maps #dataviz
Maps often show Greenland as massive, almost as big as Africa. But in reality, Africa is 14x larger! This distortion comes from the Mercator projection, which enlarges areas near the poles.
You can see how it really look like on www.thetruesize.com
#maps #dataviz

December 18, 2024 at 8:58 AM
This offers a fascinating perspective from both #dataviz and data collection standpoints.
It’s a great example of how the way we choose to communicate data can shift its interpretive "frame."
It’s a great example of how the way we choose to communicate data can shift its interpretive "frame."

December 10, 2024 at 2:22 PM
This offers a fascinating perspective from both #dataviz and data collection standpoints.
It’s a great example of how the way we choose to communicate data can shift its interpretive "frame."
It’s a great example of how the way we choose to communicate data can shift its interpretive "frame."
This #horrorchart was featured in a 2024 Nobel Prize lecture in economic sciences:
www.youtube.com/live/YcuxbYU...
The issue highlights how many fields still use graphs while making glaring mistakes like this, often without much consideration.
#dataviz
www.youtube.com/live/YcuxbYU...
The issue highlights how many fields still use graphs while making glaring mistakes like this, often without much consideration.
#dataviz

December 10, 2024 at 2:16 PM
This #horrorchart was featured in a 2024 Nobel Prize lecture in economic sciences:
www.youtube.com/live/YcuxbYU...
The issue highlights how many fields still use graphs while making glaring mistakes like this, often without much consideration.
#dataviz
www.youtube.com/live/YcuxbYU...
The issue highlights how many fields still use graphs while making glaring mistakes like this, often without much consideration.
#dataviz
The 2CO3 Communicating Complexity publication, based on the event held at the University of Sassari in 2022, is now available for free.
Download it here: series.francoangeli.it/index.php/oa...
Inside:
🔵 Infographics
🔵 Papers
🔵 Dataviz animation
🔵 Interactive dataviz
#dataviz 📊 #design
Download it here: series.francoangeli.it/index.php/oa...
Inside:
🔵 Infographics
🔵 Papers
🔵 Dataviz animation
🔵 Interactive dataviz
#dataviz 📊 #design


December 9, 2024 at 9:03 PM
The 2CO3 Communicating Complexity publication, based on the event held at the University of Sassari in 2022, is now available for free.
Download it here: series.francoangeli.it/index.php/oa...
Inside:
🔵 Infographics
🔵 Papers
🔵 Dataviz animation
🔵 Interactive dataviz
#dataviz 📊 #design
Download it here: series.francoangeli.it/index.php/oa...
Inside:
🔵 Infographics
🔵 Papers
🔵 Dataviz animation
🔵 Interactive dataviz
#dataviz 📊 #design

(Almost) the entire program of EU Open Data Days 2025 has been published. Many speeches on #OpenData and #Dataviz. Among the speakers, I would like to highlight: @sverhulst.bsky.social,
@tulpinteractive.com, @nadiehbremer.com.
data.europa.eu/en/euopendat...
@tulpinteractive.com, @nadiehbremer.com.
data.europa.eu/en/euopendat...

December 4, 2024 at 11:12 AM
(Almost) the entire program of EU Open Data Days 2025 has been published. Many speeches on #OpenData and #Dataviz. Among the speakers, I would like to highlight: @sverhulst.bsky.social,
@tulpinteractive.com, @nadiehbremer.com.
data.europa.eu/en/euopendat...
@tulpinteractive.com, @nadiehbremer.com.
data.europa.eu/en/euopendat...
Interesting historical data visualization resources: Willard C. Brinton's 1914 and 1939 books on Internet Archive for free. These volumes offer insights that still resonate with contemporary data visualization practices.
🟢 bit.ly/4eSaJWw
🟢 bit.ly/3ZrmKxI
#DataViz 📊
🟢 bit.ly/4eSaJWw
🟢 bit.ly/3ZrmKxI
#DataViz 📊


November 29, 2024 at 9:28 AM
Interesting historical data visualization resources: Willard C. Brinton's 1914 and 1939 books on Internet Archive for free. These volumes offer insights that still resonate with contemporary data visualization practices.
🟢 bit.ly/4eSaJWw
🟢 bit.ly/3ZrmKxI
#DataViz 📊
🟢 bit.ly/4eSaJWw
🟢 bit.ly/3ZrmKxI
#DataViz 📊
Questo report della Polizia di Stato è un concentrato di #horrorchart e cose che non si dovrebbero fare nella #dataviz.
www.poliziadistato.it/statics/17/r...
www.poliziadistato.it/statics/17/r...


November 26, 2024 at 10:02 AM
Questo report della Polizia di Stato è un concentrato di #horrorchart e cose che non si dovrebbero fare nella #dataviz.
www.poliziadistato.it/statics/17/r...
www.poliziadistato.it/statics/17/r...
Nice tool made by @jaredshort.com visualizing the color mentioned on Bluesky posts live.
www.bewitched.com/demo/rainbow...
#dataviz 📊
www.bewitched.com/demo/rainbow...
#dataviz 📊

November 24, 2024 at 3:53 PM
Nice tool made by @jaredshort.com visualizing the color mentioned on Bluesky posts live.
www.bewitched.com/demo/rainbow...
#dataviz 📊
www.bewitched.com/demo/rainbow...
#dataviz 📊
Open Coesione sta allargando il team e cerca diversi profili, non solo tecnici.
🗓️ Candidature ammesse fino al 3 dicembre.
opencoesione.gov.it/it/news/pubb...
#opendata #lavoro
🗓️ Candidature ammesse fino al 3 dicembre.
opencoesione.gov.it/it/news/pubb...
#opendata #lavoro

November 24, 2024 at 8:14 AM
Open Coesione sta allargando il team e cerca diversi profili, non solo tecnici.
🗓️ Candidature ammesse fino al 3 dicembre.
opencoesione.gov.it/it/news/pubb...
#opendata #lavoro
🗓️ Candidature ammesse fino al 3 dicembre.
opencoesione.gov.it/it/news/pubb...
#opendata #lavoro
🚨 Dream job alert!
The Giorgia Lupi's #dataviz 📊 team in Pentagram is looking for a mid-level/senior Graphic Designer with #UX #UI skills.
drive.google.com/file/d/16Vgz...
The Giorgia Lupi's #dataviz 📊 team in Pentagram is looking for a mid-level/senior Graphic Designer with #UX #UI skills.
drive.google.com/file/d/16Vgz...

November 18, 2024 at 6:06 PM
🚨 Dream job alert!
The Giorgia Lupi's #dataviz 📊 team in Pentagram is looking for a mid-level/senior Graphic Designer with #UX #UI skills.
drive.google.com/file/d/16Vgz...
The Giorgia Lupi's #dataviz 📊 team in Pentagram is looking for a mid-level/senior Graphic Designer with #UX #UI skills.
drive.google.com/file/d/16Vgz...
The best #dataviz of the #USAelections this year is from the Onion News Network.
Full video: youtu.be/9qI0LTmSr38?...
#USA #Elections 📊
Full video: youtu.be/9qI0LTmSr38?...
#USA #Elections 📊
November 5, 2024 at 11:28 PM
The best #dataviz of the #USAelections this year is from the Onion News Network.
Full video: youtu.be/9qI0LTmSr38?...
#USA #Elections 📊
Full video: youtu.be/9qI0LTmSr38?...
#USA #Elections 📊
It seems also there is a strike of the staff involved in the data pipeline so they are not sure to publish it.

November 5, 2024 at 11:07 PM
It seems also there is a strike of the staff involved in the data pipeline so they are not sure to publish it.