
Manvendra Dubey
@mkdubey.bsky.social
50 followers
22 following
19 posts
Earth and Energy Research for Sustainable Prosperity by Scaling Innovations in Science and Technology. Works in the field and lab and with people to use science to advance humanity.
Posts
Media
Videos
Starter Packs


Manvendra Dubey
@mkdubey.bsky.social
· Aug 30
Black carbon finding makes Earth system models more accurate | LANL
This finding will make Earth system models much more accurate, which will help the United States to better understand and manage national security interests in the Arctic and Antarctica.
www.lanl.gov
Manvendra Dubey
@mkdubey.bsky.social
· Aug 6

Dubey joins United Nations panel to study nuclear war effects | LANL
Laboratory Fellow Manvendra Dubey was selected to serve on an independent scientific panel that will examine the consequences of nuclear war for the United Nations General Assembly.
www.lanl.gov


Manvendra Dubey
@mkdubey.bsky.social
· Jun 23


Manvendra Dubey
@mkdubey.bsky.social
· Jun 8

Representation of Arctic Winter Atmospheric Boundary Layer Stability Over Sea Ice in CMIP6 Models
A cloudy state, without strong low-level stability (LLS), is often observed over winter Arctic sea ice but is absent in most Coupled Model Intercomparison Project (CMIP6) models CMIP6 models show...
agupubs.onlinelibrary.wiley.com
Manvendra Dubey
@mkdubey.bsky.social
· Jun 6

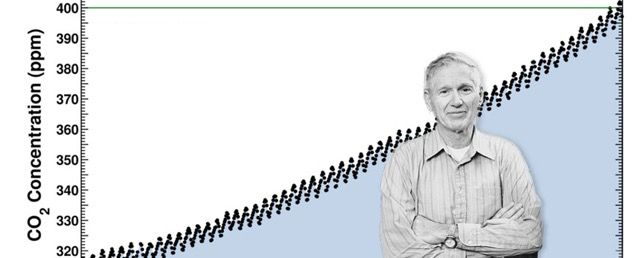
The Keeling Curve Foundation | A Legacy of Long-Term Scientific Observations
Our mission is to recognize, inspire, and promote accurate long-term observations of the environment, and to communicate their significance for mitigating and adapting to climate change.
www.keelingcurve.org
Manvendra Dubey
@mkdubey.bsky.social
· Jun 6

Manvendra Dubey
@mkdubey.bsky.social
· Jun 6

