


Pablo Almunia
@pabloalmunia.bsky.social
Spanish professional in Brussels. Studied Philosophy, Computer Science, and Business Administration. Now, I am focused on data visualization at GRAPHERY.
The #30DayChartChallenge is interesting. Some of the charts we have made are mediocre, but others are quite interesting. We have tested the #graphane micro-framework with many forms of visualization and we are satisfied with the result.
playground.graphane.dev/gallery/@pal...
playground.graphane.dev/gallery/@pal...

April 30, 2025 at 6:07 AM
The #30DayChartChallenge is interesting. Some of the charts we have made are mediocre, but others are quite interesting. We have tested the #graphane micro-framework with many forms of visualization and we are satisfied with the result.
playground.graphane.dev/gallery/@pal...
playground.graphane.dev/gallery/@pal...
Discover the fascinating timeline of Methuselah, the world's oldest tree! 🌳 From the Great Pyramid to the Moon Landing.
Day 30 | Uncertainties - theme day: national geographic | #30DayChartChallenge
#DataVisualization made with #Graphane
playground.graphane.dev/editor/gr0vb...
Day 30 | Uncertainties - theme day: national geographic | #30DayChartChallenge
#DataVisualization made with #Graphane
playground.graphane.dev/editor/gr0vb...

April 30, 2025 at 5:49 AM
Discover the fascinating timeline of Methuselah, the world's oldest tree! 🌳 From the Great Pyramid to the Moon Landing.
Day 30 | Uncertainties - theme day: national geographic | #30DayChartChallenge
#DataVisualization made with #Graphane
playground.graphane.dev/editor/gr0vb...
Day 30 | Uncertainties - theme day: national geographic | #30DayChartChallenge
#DataVisualization made with #Graphane
playground.graphane.dev/editor/gr0vb...
Humans have launched a few objects into interstellar space. One of them may be found by aliens.
Day 29 | Uncertainties - extraterrestrial | #30DayChartChallenge
#DataVisualization made with #Graphane
playground.graphane.dev/editor/gn5f0...
Day 29 | Uncertainties - extraterrestrial | #30DayChartChallenge
#DataVisualization made with #Graphane
playground.graphane.dev/editor/gn5f0...

April 29, 2025 at 8:43 AM
Humans have launched a few objects into interstellar space. One of them may be found by aliens.
Day 29 | Uncertainties - extraterrestrial | #30DayChartChallenge
#DataVisualization made with #Graphane
playground.graphane.dev/editor/gn5f0...
Day 29 | Uncertainties - extraterrestrial | #30DayChartChallenge
#DataVisualization made with #Graphane
playground.graphane.dev/editor/gn5f0...
Everyone is on the move and has to be integrated into a new place. See the dynamics of internal movements, migrants and immigrants in Spain.
Day 28 | Uncertainties - inclusion | #30DayChartChallenge
#DataVisualization made with #Graphane
playground.graphane.dev/editor/g218k...
Day 28 | Uncertainties - inclusion | #30DayChartChallenge
#DataVisualization made with #Graphane
playground.graphane.dev/editor/g218k...
April 28, 2025 at 9:51 PM
Everyone is on the move and has to be integrated into a new place. See the dynamics of internal movements, migrants and immigrants in Spain.
Day 28 | Uncertainties - inclusion | #30DayChartChallenge
#DataVisualization made with #Graphane
playground.graphane.dev/editor/g218k...
Day 28 | Uncertainties - inclusion | #30DayChartChallenge
#DataVisualization made with #Graphane
playground.graphane.dev/editor/g218k...
Day 28 | Uncertainties - inclusion | #30DayChartChallenge
Comprueba como es tu percepción de la #migración en #España en www.lamigracion.es
Comprueba como es tu percepción de la #migración en #España en www.lamigracion.es
April 28, 2025 at 9:03 AM
Day 28 | Uncertainties - inclusion | #30DayChartChallenge
Comprueba como es tu percepción de la #migración en #España en www.lamigracion.es
Comprueba como es tu percepción de la #migración en #España en www.lamigracion.es
Check out the average noise in #Madrid from 2011 to 2024
Day 27 | Uncertainties - noise | #30DayChartChallenge
#DataVisualization made with #Graphane
playground.graphane.dev/editor/gxtqn...
Day 27 | Uncertainties - noise | #30DayChartChallenge
#DataVisualization made with #Graphane
playground.graphane.dev/editor/gxtqn...
April 27, 2025 at 3:30 PM
Check out the average noise in #Madrid from 2011 to 2024
Day 27 | Uncertainties - noise | #30DayChartChallenge
#DataVisualization made with #Graphane
playground.graphane.dev/editor/gxtqn...
Day 27 | Uncertainties - noise | #30DayChartChallenge
#DataVisualization made with #Graphane
playground.graphane.dev/editor/gxtqn...
Check out the population structure (over 16 year old) in #Spain
Day 26 | Uncertainties - monochrome | #30DayChartChallenge
#DataVisualization made with #Graphane
playground.graphane.dev/editor/gcllh...
Day 26 | Uncertainties - monochrome | #30DayChartChallenge
#DataVisualization made with #Graphane
playground.graphane.dev/editor/gcllh...

April 26, 2025 at 1:55 PM
Check out the population structure (over 16 year old) in #Spain
Day 26 | Uncertainties - monochrome | #30DayChartChallenge
#DataVisualization made with #Graphane
playground.graphane.dev/editor/gcllh...
Day 26 | Uncertainties - monochrome | #30DayChartChallenge
#DataVisualization made with #Graphane
playground.graphane.dev/editor/gcllh...
Check out our Disease Risks Matrix for the EU average! Visualizing impact and probability levels of various diseases. #HealthData #EUDiseaseRisks
Day 25 | Uncertainties - risk | #30DayChartChallenge
#DataVisualization made with #Graphane
playground.graphane.dev/editor/gmt6p...
Day 25 | Uncertainties - risk | #30DayChartChallenge
#DataVisualization made with #Graphane
playground.graphane.dev/editor/gmt6p...

April 25, 2025 at 5:02 AM
Check out our Disease Risks Matrix for the EU average! Visualizing impact and probability levels of various diseases. #HealthData #EUDiseaseRisks
Day 25 | Uncertainties - risk | #30DayChartChallenge
#DataVisualization made with #Graphane
playground.graphane.dev/editor/gmt6p...
Day 25 | Uncertainties - risk | #30DayChartChallenge
#DataVisualization made with #Graphane
playground.graphane.dev/editor/gmt6p...
Check out the highest adult #obesity rates by country! Discover which nations are leading in obesity prevalence. #health #nutrition #WHO
Day 24 | Timeseries - data day: WHO | #30DayChartChallenge
#DataVisualization made with #Graphane
playground.graphane.dev/editor/gggov...
Day 24 | Timeseries - data day: WHO | #30DayChartChallenge
#DataVisualization made with #Graphane
playground.graphane.dev/editor/gggov...

April 24, 2025 at 5:18 AM
Check out the highest adult #obesity rates by country! Discover which nations are leading in obesity prevalence. #health #nutrition #WHO
Day 24 | Timeseries - data day: WHO | #30DayChartChallenge
#DataVisualization made with #Graphane
playground.graphane.dev/editor/gggov...
Day 24 | Timeseries - data day: WHO | #30DayChartChallenge
#DataVisualization made with #Graphane
playground.graphane.dev/editor/gggov...
Check out this dynamic visualization of #Airbnb revenues from 2014 to 2024! Explore the differences between linear and logarithmic scales.
Day 23 | Timeseries - log scale | #30DayChartChallenge
#DataVisualization made with #Graphane
playground.graphane.dev/editor/geu98...
Day 23 | Timeseries - log scale | #30DayChartChallenge
#DataVisualization made with #Graphane
playground.graphane.dev/editor/geu98...
April 23, 2025 at 4:54 AM
Check out this dynamic visualization of #Airbnb revenues from 2014 to 2024! Explore the differences between linear and logarithmic scales.
Day 23 | Timeseries - log scale | #30DayChartChallenge
#DataVisualization made with #Graphane
playground.graphane.dev/editor/geu98...
Day 23 | Timeseries - log scale | #30DayChartChallenge
#DataVisualization made with #Graphane
playground.graphane.dev/editor/geu98...
Celebrating the iconic music stars from the 50s to the 80s! 🌟 Check out the EAS (Equivalent Album Sales) of legends by decade #ChartMasters #MusicHistory
Day 22 | Timeseries - stars | #30DayChartChallenge
#DataVisualization made with #Graphane
playground.graphane.dev/editor/g2q09...
Day 22 | Timeseries - stars | #30DayChartChallenge
#DataVisualization made with #Graphane
playground.graphane.dev/editor/g2q09...

April 22, 2025 at 9:27 AM
Celebrating the iconic music stars from the 50s to the 80s! 🌟 Check out the EAS (Equivalent Album Sales) of legends by decade #ChartMasters #MusicHistory
Day 22 | Timeseries - stars | #30DayChartChallenge
#DataVisualization made with #Graphane
playground.graphane.dev/editor/g2q09...
Day 22 | Timeseries - stars | #30DayChartChallenge
#DataVisualization made with #Graphane
playground.graphane.dev/editor/g2q09...
I'm now 3 weeks and 21 charts into the #30DayChartChallenge. Some of them are more interesting and attractive than others, but it's been very interesting to make #DataViz with #Graphane for each of the daily themes.
playground.graphane.dev/gallery/@pal...
playground.graphane.dev/gallery/@pal...

April 21, 2025 at 7:13 AM
I'm now 3 weeks and 21 charts into the #30DayChartChallenge. Some of them are more interesting and attractive than others, but it's been very interesting to make #DataViz with #Graphane for each of the daily themes.
playground.graphane.dev/gallery/@pal...
playground.graphane.dev/gallery/@pal...
Discover the top 10 countries with the largest proven #OilReserves! Reflect on #Energy #Geopolitics and #Sustainability.
Day 21 | Timeseries - fossils | #30DayChartChallenge
#DataVisualization made with #Graphane
playground.graphane.dev/editor/gs4aa...
Day 21 | Timeseries - fossils | #30DayChartChallenge
#DataVisualization made with #Graphane
playground.graphane.dev/editor/gs4aa...

April 21, 2025 at 7:04 AM
Discover the top 10 countries with the largest proven #OilReserves! Reflect on #Energy #Geopolitics and #Sustainability.
Day 21 | Timeseries - fossils | #30DayChartChallenge
#DataVisualization made with #Graphane
playground.graphane.dev/editor/gs4aa...
Day 21 | Timeseries - fossils | #30DayChartChallenge
#DataVisualization made with #Graphane
playground.graphane.dev/editor/gs4aa...
Exploring the urbanization of Andalusia's maritime coastal domain through a dynamic data visualization! #Andalusia #Spain #Urbanization
Day 20 | Timeseries - urbanization | #30DayChartChallenge
#DataVisualization made with #Graphane
playground.graphane.dev/editor/gt6mj...
Day 20 | Timeseries - urbanization | #30DayChartChallenge
#DataVisualization made with #Graphane
playground.graphane.dev/editor/gt6mj...
April 20, 2025 at 4:18 PM
Exploring the urbanization of Andalusia's maritime coastal domain through a dynamic data visualization! #Andalusia #Spain #Urbanization
Day 20 | Timeseries - urbanization | #30DayChartChallenge
#DataVisualization made with #Graphane
playground.graphane.dev/editor/gt6mj...
Day 20 | Timeseries - urbanization | #30DayChartChallenge
#DataVisualization made with #Graphane
playground.graphane.dev/editor/gt6mj...
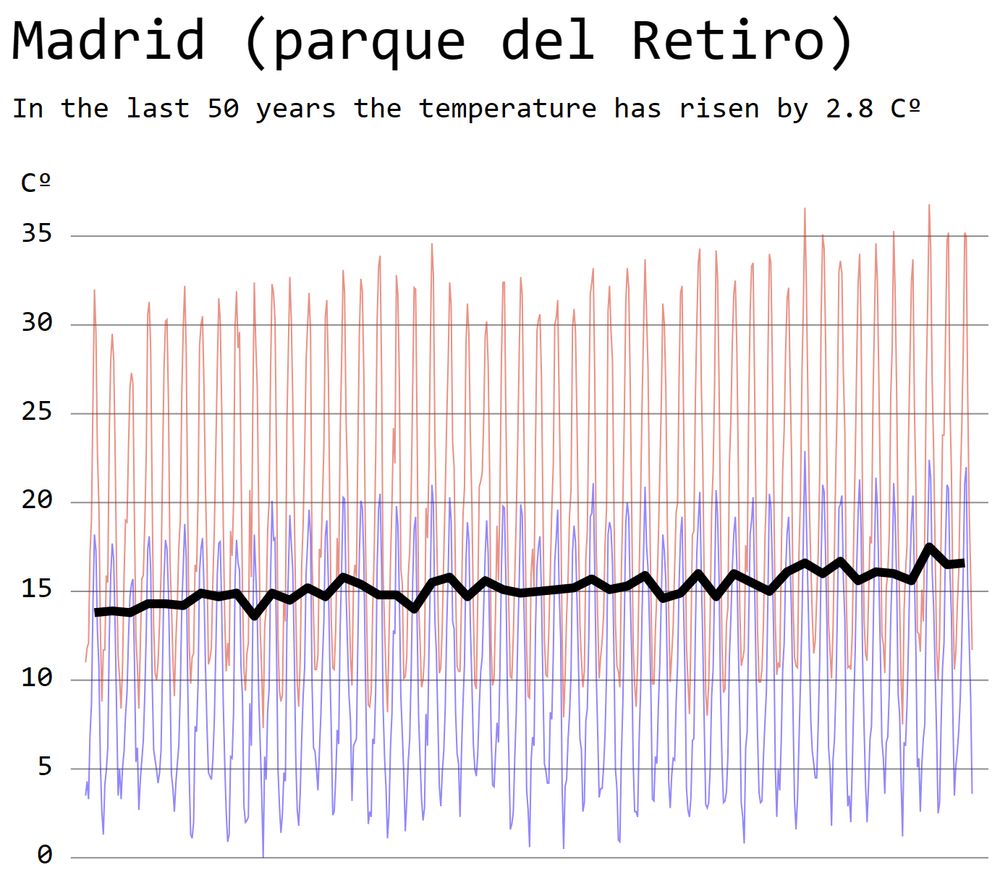
🌡️ Over the past 50 years, temperature of #Madrid has risen by 2.8°C! The monthly variation is not clear, but the annual average temperature is.
Day 19 | Timeseries - smooth | #30DayChartChallenge
#DataVisualization made with #Graphane
playground.graphane.dev/editor/gma4n...
Day 19 | Timeseries - smooth | #30DayChartChallenge
#DataVisualization made with #Graphane
playground.graphane.dev/editor/gma4n...
April 19, 2025 at 4:13 PM
🌡️ Over the past 50 years, temperature of #Madrid has risen by 2.8°C! The monthly variation is not clear, but the annual average temperature is.
Day 19 | Timeseries - smooth | #30DayChartChallenge
#DataVisualization made with #Graphane
playground.graphane.dev/editor/gma4n...
Day 19 | Timeseries - smooth | #30DayChartChallenge
#DataVisualization made with #Graphane
playground.graphane.dev/editor/gma4n...
See the updated S&P500 #dataviz during the presidential transition from Biden to Trump, initially published by
@kikollan.llaneras.es on @elpais.com
Day 18 | Relationship - theme day: El País | #30DayChartChallenge
#DataVisualization made with #Graphane
playground.graphane.dev/editor/g3j7d...
@kikollan.llaneras.es on @elpais.com
Day 18 | Relationship - theme day: El País | #30DayChartChallenge
#DataVisualization made with #Graphane
playground.graphane.dev/editor/g3j7d...

April 18, 2025 at 7:51 AM
See the updated S&P500 #dataviz during the presidential transition from Biden to Trump, initially published by
@kikollan.llaneras.es on @elpais.com
Day 18 | Relationship - theme day: El País | #30DayChartChallenge
#DataVisualization made with #Graphane
playground.graphane.dev/editor/g3j7d...
@kikollan.llaneras.es on @elpais.com
Day 18 | Relationship - theme day: El País | #30DayChartChallenge
#DataVisualization made with #Graphane
playground.graphane.dev/editor/g3j7d...
Check out our dashboard showing Europe's critically endangered birds on #UICNRedList! Urgent #conservation of #EndangeredSpecies.
Day 17 | Relationship - birds | #30DayChartChallenge
#DataVisualization made with #Graphane
playground.graphane.dev/editor/god4f...
Day 17 | Relationship - birds | #30DayChartChallenge
#DataVisualization made with #Graphane
playground.graphane.dev/editor/god4f...

April 17, 2025 at 7:05 AM
Check out our dashboard showing Europe's critically endangered birds on #UICNRedList! Urgent #conservation of #EndangeredSpecies.
Day 17 | Relationship - birds | #30DayChartChallenge
#DataVisualization made with #Graphane
playground.graphane.dev/editor/god4f...
Day 17 | Relationship - birds | #30DayChartChallenge
#DataVisualization made with #Graphane
playground.graphane.dev/editor/god4f...
#UBER #financial results, including information on quarterly net income/loss and cumulative losses over the years. It's very significant need for funds!
Day 16 | Relationship - negative | #30DayChartChallenge
#DataVisualization made with #Graphane
playground.graphane.dev/editor/gxxf1...
Day 16 | Relationship - negative | #30DayChartChallenge
#DataVisualization made with #Graphane
playground.graphane.dev/editor/gxxf1...

April 16, 2025 at 11:04 AM
#UBER #financial results, including information on quarterly net income/loss and cumulative losses over the years. It's very significant need for funds!
Day 16 | Relationship - negative | #30DayChartChallenge
#DataVisualization made with #Graphane
playground.graphane.dev/editor/gxxf1...
Day 16 | Relationship - negative | #30DayChartChallenge
#DataVisualization made with #Graphane
playground.graphane.dev/editor/gxxf1...
This visualization of the #PMBOK 6th Edition processes illustrates the relationships between different #ProjectManagement processes
Day 15 | Relationship - complicated | #30DayChartChallenge
#DataVisualization made with #Graphane
playground.graphane.dev/editor/gfy6c...
Day 15 | Relationship - complicated | #30DayChartChallenge
#DataVisualization made with #Graphane
playground.graphane.dev/editor/gfy6c...

April 15, 2025 at 7:55 AM
This visualization of the #PMBOK 6th Edition processes illustrates the relationships between different #ProjectManagement processes
Day 15 | Relationship - complicated | #30DayChartChallenge
#DataVisualization made with #Graphane
playground.graphane.dev/editor/gfy6c...
Day 15 | Relationship - complicated | #30DayChartChallenge
#DataVisualization made with #Graphane
playground.graphane.dev/editor/gfy6c...
Check out this visual representation of the #taxonomy of #humans, from Domain to Species.
Day 14 | Relationship - kinship (personal version) | #30DayChartChallenge
#DataVisualization made with #Graphane
playground.graphane.dev/editor/gdedi...
Day 14 | Relationship - kinship (personal version) | #30DayChartChallenge
#DataVisualization made with #Graphane
playground.graphane.dev/editor/gdedi...

April 14, 2025 at 3:57 PM
Check out this visual representation of the #taxonomy of #humans, from Domain to Species.
Day 14 | Relationship - kinship (personal version) | #30DayChartChallenge
#DataVisualization made with #Graphane
playground.graphane.dev/editor/gdedi...
Day 14 | Relationship - kinship (personal version) | #30DayChartChallenge
#DataVisualization made with #Graphane
playground.graphane.dev/editor/gdedi...
This graph visualize the sugar content in various fruits and vegetables.
Day 13 | Relationship - clusters | #30DayChartChallenge
#DataVisualization made with #Graphane
playground.graphane.dev/editor/gtpy6...
Day 13 | Relationship - clusters | #30DayChartChallenge
#DataVisualization made with #Graphane
playground.graphane.dev/editor/gtpy6...

April 14, 2025 at 2:55 PM
This graph visualize the sugar content in various fruits and vegetables.
Day 13 | Relationship - clusters | #30DayChartChallenge
#DataVisualization made with #Graphane
playground.graphane.dev/editor/gtpy6...
Day 13 | Relationship - clusters | #30DayChartChallenge
#DataVisualization made with #Graphane
playground.graphane.dev/editor/gtpy6...
This graph visualizes the birth rates per 1,000 women in the United States from 1989 to 2019.
Day 12 | Distribution - Data day: data.gov | #30DayChartChallenge
#DataVisualization made with #Graphane
playground.graphane.dev/editor/gtflo...
Day 12 | Distribution - Data day: data.gov | #30DayChartChallenge
#DataVisualization made with #Graphane
playground.graphane.dev/editor/gtflo...

April 14, 2025 at 7:40 AM
This graph visualizes the birth rates per 1,000 women in the United States from 1989 to 2019.
Day 12 | Distribution - Data day: data.gov | #30DayChartChallenge
#DataVisualization made with #Graphane
playground.graphane.dev/editor/gtflo...
Day 12 | Distribution - Data day: data.gov | #30DayChartChallenge
#DataVisualization made with #Graphane
playground.graphane.dev/editor/gtflo...
The rain in Seville is very rare | La lluvía en Sevilla es una maravilla
Day 11 | Distribution - Stripes | #30DayChartChallenge
#DataVisualization made with #Graphane
#DataViz #Seville #Sevilla #rain #clima
playground.graphane.dev/editor/g3san...
Day 11 | Distribution - Stripes | #30DayChartChallenge
#DataVisualization made with #Graphane
#DataViz #Seville #Sevilla #rain #clima
playground.graphane.dev/editor/g3san...

April 11, 2025 at 4:44 AM
The rain in Seville is very rare | La lluvía en Sevilla es una maravilla
Day 11 | Distribution - Stripes | #30DayChartChallenge
#DataVisualization made with #Graphane
#DataViz #Seville #Sevilla #rain #clima
playground.graphane.dev/editor/g3san...
Day 11 | Distribution - Stripes | #30DayChartChallenge
#DataVisualization made with #Graphane
#DataViz #Seville #Sevilla #rain #clima
playground.graphane.dev/editor/g3san...
Check out our latest visualization of hourly train passengers in Barcelona! 🚆 The graph reveals peak times. #DataViz #Barcelona #TrainTravel
Day 10 | Distribution - Multi-modal | #30DayChartChallenge
#DataVisualization made with #Graphane
playground.graphane.dev/editor/g1z8z...
Day 10 | Distribution - Multi-modal | #30DayChartChallenge
#DataVisualization made with #Graphane
playground.graphane.dev/editor/g1z8z...

April 10, 2025 at 7:16 AM
Check out our latest visualization of hourly train passengers in Barcelona! 🚆 The graph reveals peak times. #DataViz #Barcelona #TrainTravel
Day 10 | Distribution - Multi-modal | #30DayChartChallenge
#DataVisualization made with #Graphane
playground.graphane.dev/editor/g1z8z...
Day 10 | Distribution - Multi-modal | #30DayChartChallenge
#DataVisualization made with #Graphane
playground.graphane.dev/editor/g1z8z...
Check out this data visualization showcasing perceptions about the future across different EU countries!
Day 9 | Distribution - Diverging | #30DayChartChallenge
#DataViz #FuturePerception #EU
#DataVisualization made with #Graphane
playground.graphane.dev/editor/gamfl...
Day 9 | Distribution - Diverging | #30DayChartChallenge
#DataViz #FuturePerception #EU
#DataVisualization made with #Graphane
playground.graphane.dev/editor/gamfl...

April 9, 2025 at 6:24 AM
Check out this data visualization showcasing perceptions about the future across different EU countries!
Day 9 | Distribution - Diverging | #30DayChartChallenge
#DataViz #FuturePerception #EU
#DataVisualization made with #Graphane
playground.graphane.dev/editor/gamfl...
Day 9 | Distribution - Diverging | #30DayChartChallenge
#DataViz #FuturePerception #EU
#DataVisualization made with #Graphane
playground.graphane.dev/editor/gamfl...