Philippe Jawinski
@pjawinski.bsky.social
72 followers
99 following
16 posts
Neuroscientist | Postdoc @ Humboldt-Universität zu Berlin. Interested in biological psychology, sleep 😴, neuroimaging 🧠, and molecular genetics 🧬.
https://hu-berlin.de/jawinski
Posts
Media
Videos
Starter Packs


Reposted by Philippe Jawinski


Reposted by Philippe Jawinski

Reposted by Philippe Jawinski

Marijn Schipper
@mjschipper.bsky.social
· Feb 11
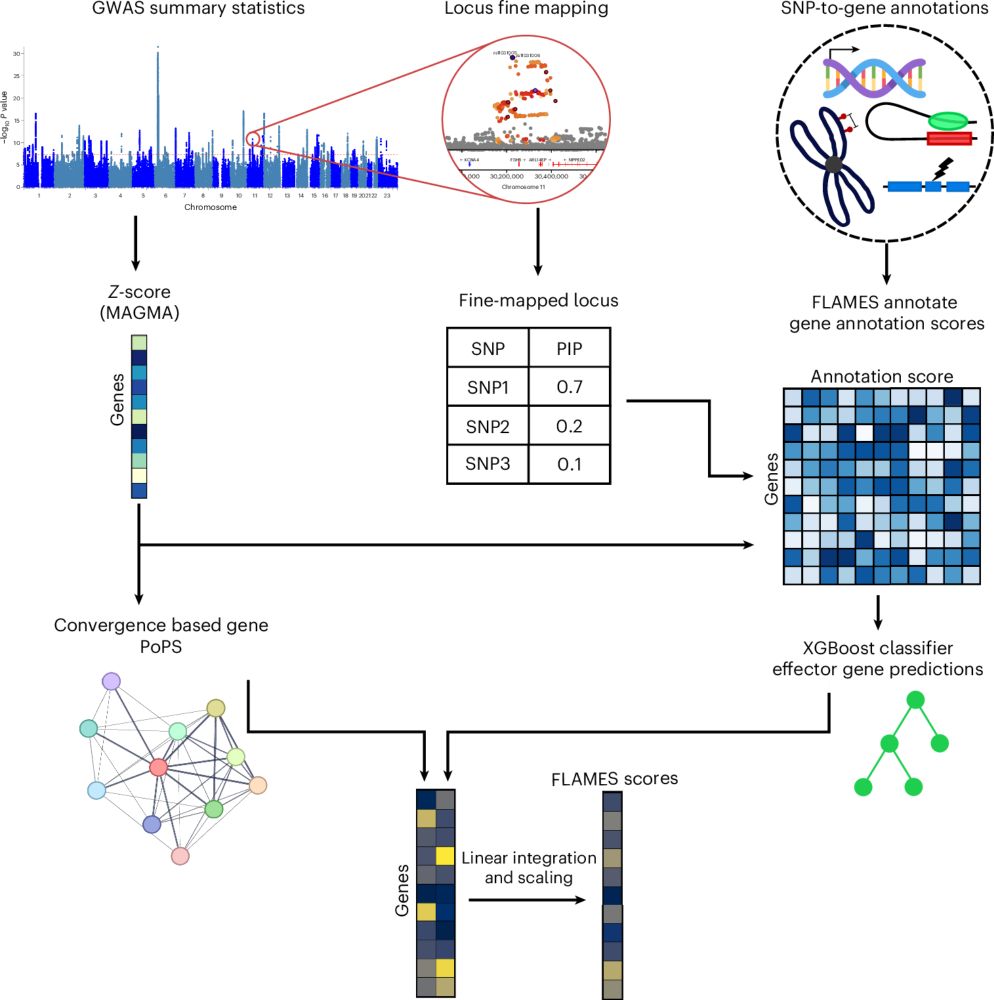
Prioritizing effector genes at trait-associated loci using multimodal evidence
Nature Genetics - FLAMES is a machine learning approach combining variant fine-mapping, SNP-to-gene annotations and convergence-based gene prioritization scores to identify candidate effector genes...
rdcu.be