


Ronnie François
@ronniefrancois.bsky.social
Research interests in MPAs, Corals, Elasmobranch & GIS • MSc in Fisheries Science @ James Cook University • BSc in Marine Science @ University of Mauritius • AustraliaAwards alumni • 🇲🇺
Reposted by Ronnie François
Looking for a professional society or association that focuses on sharks🦈
How about one dealing with seagrass in the Indo-Pacific 🌏
What about scientific diving 🤿
Or ocean technology and engineering 🛰️
This list could be just what you're looking for 🔍
www.oceanoculus.com/...
How about one dealing with seagrass in the Indo-Pacific 🌏
What about scientific diving 🤿
Or ocean technology and engineering 🛰️
This list could be just what you're looking for 🔍
www.oceanoculus.com/...

Professional Societies and Associations for the Marine STEM Community
Are you working or studying in a marine STEAM (Science, Technology,
Engineering, Arts, or Maths) field? Looking for a professional society or
association? Here’s a list from around the world.
www.oceanoculus.com
March 26, 2025 at 10:45 AM
Looking for a professional society or association that focuses on sharks🦈
How about one dealing with seagrass in the Indo-Pacific 🌏
What about scientific diving 🤿
Or ocean technology and engineering 🛰️
This list could be just what you're looking for 🔍
www.oceanoculus.com/...
How about one dealing with seagrass in the Indo-Pacific 🌏
What about scientific diving 🤿
Or ocean technology and engineering 🛰️
This list could be just what you're looking for 🔍
www.oceanoculus.com/...
Reposted by Ronnie François
It’s time for WTF (What’s That Fish)! 😍
This is a mahi-mahi
It’s time for another WTF (What’s That Fish)! 😍
This is a mahi-mahi. Apparently, they can swim at speeds up to around 64 kilometres per hour (that's 40 miles per hour for those who use imperial measurements)!
📷 credit: NOAA Fisheries
This is a mahi-mahi
It’s time for another WTF (What’s That Fish)! 😍
This is a mahi-mahi. Apparently, they can swim at speeds up to around 64 kilometres per hour (that's 40 miles per hour for those who use imperial measurements)!
📷 credit: NOAA Fisheries

March 10, 2025 at 2:13 PM
It’s time for WTF (What’s That Fish)! 😍
This is a mahi-mahi
It’s time for another WTF (What’s That Fish)! 😍
This is a mahi-mahi. Apparently, they can swim at speeds up to around 64 kilometres per hour (that's 40 miles per hour for those who use imperial measurements)!
📷 credit: NOAA Fisheries
This is a mahi-mahi
It’s time for another WTF (What’s That Fish)! 😍
This is a mahi-mahi. Apparently, they can swim at speeds up to around 64 kilometres per hour (that's 40 miles per hour for those who use imperial measurements)!
📷 credit: NOAA Fisheries
Reposted by Ronnie François
Dive into stat modeling&applications, relaxing assumptions, predictive accuracy, preserving information, imputation, model validation, Bayesian models, causal specification+many controversial topics: Regression Modeling Strategies course May 15-16, 19-20 hbiostat.org/doc/rms/4day.html #StatsSky
RMS
hbiostat.org
March 9, 2025 at 5:41 PM
Dive into stat modeling&applications, relaxing assumptions, predictive accuracy, preserving information, imputation, model validation, Bayesian models, causal specification+many controversial topics: Regression Modeling Strategies course May 15-16, 19-20 hbiostat.org/doc/rms/4day.html #StatsSky
Reposted by Ronnie François

Science is designed to be self-correcting as long as we value replication as well as we should. For every type 1 error honestly made, even a single replication has a high chance of providing contrary conclusions. Replication must be scientific reflex. #edusky #statsky #phdchat #academicsky #STEM🧪
January 15, 2025 at 12:40 AM
Science is designed to be self-correcting as long as we value replication as well as we should. For every type 1 error honestly made, even a single replication has a high chance of providing contrary conclusions. Replication must be scientific reflex. #edusky #statsky #phdchat #academicsky #STEM🧪
Reposted by Ronnie François

We are so excited to launch our mini-grants program in January! Members will be able to apply for funding for personal/living expenses as well are for travel and research!

December 3, 2024 at 4:17 PM
We are so excited to launch our mini-grants program in January! Members will be able to apply for funding for personal/living expenses as well are for travel and research!
Reposted by Ronnie François
I don’t quite yet have the same reach on here as I did on Twitter, so I’m going to start a new fish game called #EtymologyEpithet, where I explain the etymology (the meaning behind a name) for all of the fishes I’ve described, starting with Cirrhilabrus isosceles, the Pintail Fairywrasse.

November 29, 2024 at 3:17 AM
I don’t quite yet have the same reach on here as I did on Twitter, so I’m going to start a new fish game called #EtymologyEpithet, where I explain the etymology (the meaning behind a name) for all of the fishes I’ve described, starting with Cirrhilabrus isosceles, the Pintail Fairywrasse.
Exciting workshop on 'Strengthening Food Security in Mauritius - The Vital Role of the Fisheries Sector'
Kuddos to the Mauritius Academy of Science and Technology for bringing together scientists & civil societies on a platform to discuss and propose actions on issues affecting Mauritian fisheries
Kuddos to the Mauritius Academy of Science and Technology for bringing together scientists & civil societies on a platform to discuss and propose actions on issues affecting Mauritian fisheries


November 28, 2024 at 10:12 AM
Exciting workshop on 'Strengthening Food Security in Mauritius - The Vital Role of the Fisheries Sector'
Kuddos to the Mauritius Academy of Science and Technology for bringing together scientists & civil societies on a platform to discuss and propose actions on issues affecting Mauritian fisheries
Kuddos to the Mauritius Academy of Science and Technology for bringing together scientists & civil societies on a platform to discuss and propose actions on issues affecting Mauritian fisheries
Reposted by Ronnie François

Data cleaning is hard. Want to make it shrimp-ler? 🦐
Check out the new book we wrote about cleaning data in R for ecologists & biologists! 😀
cleaning-data-r.ala.org.au
#rstats #quartopub #r4ds #book
@fontikar.bsky.social @mjwestgate.bsky.social @shandiya.bsky.social
Check out the new book we wrote about cleaning data in R for ecologists & biologists! 😀
cleaning-data-r.ala.org.au
#rstats #quartopub #r4ds #book
@fontikar.bsky.social @mjwestgate.bsky.social @shandiya.bsky.social

July 31, 2024 at 12:58 AM
Data cleaning is hard. Want to make it shrimp-ler? 🦐
Check out the new book we wrote about cleaning data in R for ecologists & biologists! 😀
cleaning-data-r.ala.org.au
#rstats #quartopub #r4ds #book
@fontikar.bsky.social @mjwestgate.bsky.social @shandiya.bsky.social
Check out the new book we wrote about cleaning data in R for ecologists & biologists! 😀
cleaning-data-r.ala.org.au
#rstats #quartopub #r4ds #book
@fontikar.bsky.social @mjwestgate.bsky.social @shandiya.bsky.social
Reposted by Ronnie François

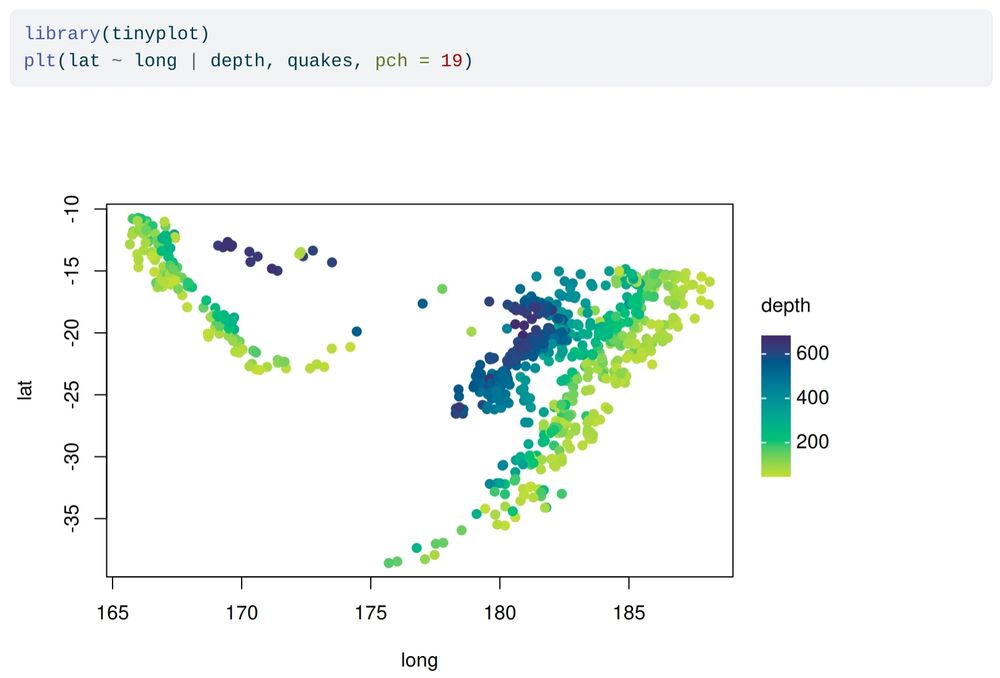
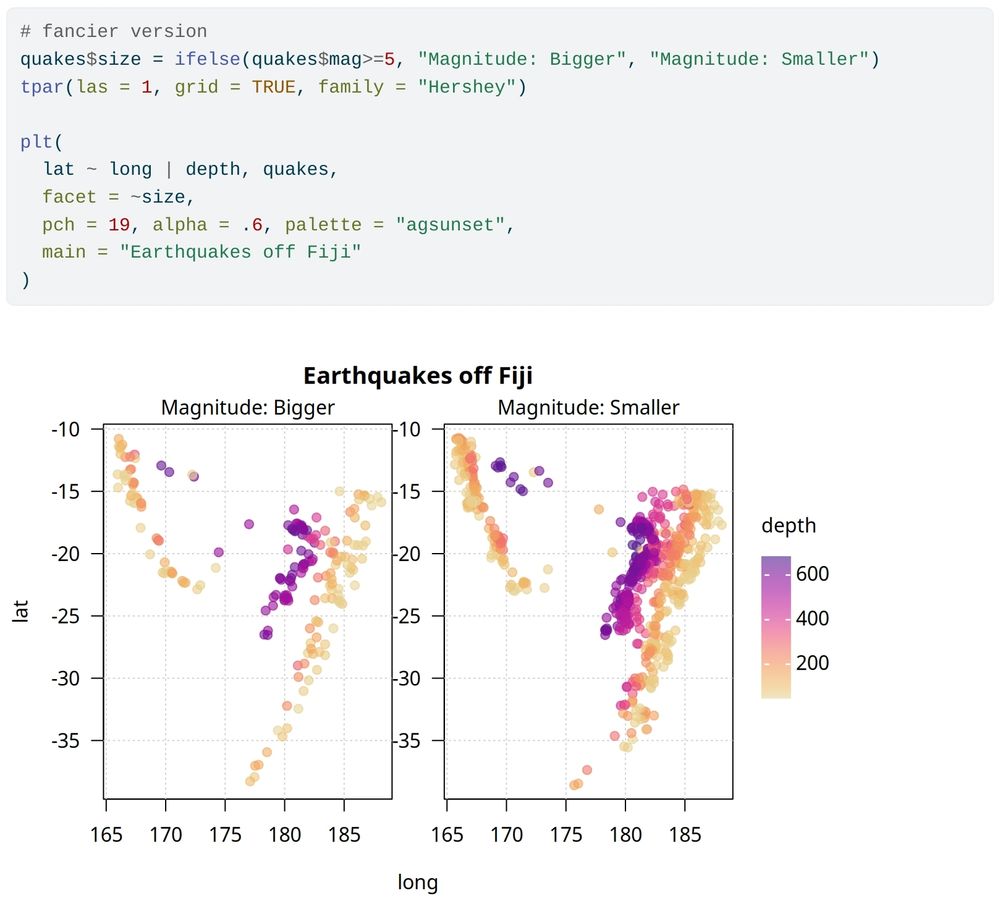
`tinyplot` is now available on CRAN. 🎉
tl;dr `tinyplot` is a super lightweight extension of the base #rstats graphics system that makes it easy to draw sophisticated plots with minimal overhead. See our website for more examples and a detailed intro tutorial. grantmcdermott.com/tinyplot/
tl;dr `tinyplot` is a super lightweight extension of the base #rstats graphics system that makes it easy to draw sophisticated plots with minimal overhead. See our website for more examples and a detailed intro tutorial. grantmcdermott.com/tinyplot/
June 20, 2024 at 9:14 PM
`tinyplot` is now available on CRAN. 🎉
tl;dr `tinyplot` is a super lightweight extension of the base #rstats graphics system that makes it easy to draw sophisticated plots with minimal overhead. See our website for more examples and a detailed intro tutorial. grantmcdermott.com/tinyplot/
tl;dr `tinyplot` is a super lightweight extension of the base #rstats graphics system that makes it easy to draw sophisticated plots with minimal overhead. See our website for more examples and a detailed intro tutorial. grantmcdermott.com/tinyplot/
Reposted by Ronnie François

Looking to better understand the different ways you can combine data files? This article has you covered! #rstats code examples provided throughout.
cghlewis.com/blog/joins/
cghlewis.com/blog/joins/

Let's talk about joins | Crystal Lewis
An review of horizontal and vertical joins with examples from education research.
cghlewis.com
March 15, 2024 at 5:46 PM
Looking to better understand the different ways you can combine data files? This article has you covered! #rstats code examples provided throughout.
cghlewis.com/blog/joins/
cghlewis.com/blog/joins/
Reposted by Ronnie François

Are you an #rstats user? Have you heard about the RStudio IDE (interactive dev envir)? Or what about its keyboard shortcuts? @posit.co
In this @libdrstats.bsky.social session I went over some basic configuration setup info & useful shortcuts
📔 docs.google.com/document/d/1...
youtu.be/_nAfJ-5nkcU
In this @libdrstats.bsky.social session I went over some basic configuration setup info & useful shortcuts
📔 docs.google.com/document/d/1...
youtu.be/_nAfJ-5nkcU
[2024-01-26] RStudio setup, projects, and shortcuts
For more information on Leonardo Collado-Torres, check https://twitter.com/lcolladotor.For more information about the materials discussed in this video, chec...
youtu.be
February 16, 2024 at 10:46 PM
Are you an #rstats user? Have you heard about the RStudio IDE (interactive dev envir)? Or what about its keyboard shortcuts? @posit.co
In this @libdrstats.bsky.social session I went over some basic configuration setup info & useful shortcuts
📔 docs.google.com/document/d/1...
youtu.be/_nAfJ-5nkcU
In this @libdrstats.bsky.social session I went over some basic configuration setup info & useful shortcuts
📔 docs.google.com/document/d/1...
youtu.be/_nAfJ-5nkcU
Reposted by Ronnie François

(3/3) The article below by Tim Radtke provides an example of how to incorporate prior assumptions into a time series forecasting model when having insufficient data.
minimizeregret.com/short-time-s...
minimizeregret.com/short-time-s...
Modeling Short Time Series with Prior Knowledge
minimizeregret.com
February 18, 2024 at 1:01 AM
(3/3) The article below by Tim Radtke provides an example of how to incorporate prior assumptions into a time series forecasting model when having insufficient data.
minimizeregret.com/short-time-s...
minimizeregret.com/short-time-s...
Reposted by Ronnie François

New version 1.6.2 of the #rstats {heplots} 📦 now going to CRAN.
It provides functions for visualizing hypothesis tests in multivariate linear models (MANOVA, multivariate regression, MANCOVA, repeated measures designs), viz equality of covariance, ...
👁️ friendly.github.io/heplots/
It provides functions for visualizing hypothesis tests in multivariate linear models (MANOVA, multivariate regression, MANCOVA, repeated measures designs), viz equality of covariance, ...
👁️ friendly.github.io/heplots/

Visualizing Hypothesis Tests in Multivariate Linear Models
Provides HE plot and other functions for visualizing hypothesis
tests in multivariate linear models. HE plots represent sums-of-squares-and-products
matrices for linear hypotheses and for err...
friendly.github.io
February 16, 2024 at 2:31 AM
New version 1.6.2 of the #rstats {heplots} 📦 now going to CRAN.
It provides functions for visualizing hypothesis tests in multivariate linear models (MANOVA, multivariate regression, MANCOVA, repeated measures designs), viz equality of covariance, ...
👁️ friendly.github.io/heplots/
It provides functions for visualizing hypothesis tests in multivariate linear models (MANOVA, multivariate regression, MANCOVA, repeated measures designs), viz equality of covariance, ...
👁️ friendly.github.io/heplots/
Reposted by Ronnie François

Great resource for researchers who want to use #RStats for robust causal analysis. Helped me understand the logic behind DAGs (directed acyclic graphs): www.r-causal.org Thanks @malcolmbarrett.malco.io @lucystats.bsky.social & @travisgerke.bsky.social 🙏

February 12, 2024 at 9:17 PM
Great resource for researchers who want to use #RStats for robust causal analysis. Helped me understand the logic behind DAGs (directed acyclic graphs): www.r-causal.org Thanks @malcolmbarrett.malco.io @lucystats.bsky.social & @travisgerke.bsky.social 🙏
Reposted by Ronnie François

#statstab #22 Plot model coefficients with {ggcoef_model()}
Thoughts: Very useful for quick plotting while drafting a write-up. Helper packages are good, but we can easily fall back into the cookbook method of stats.
#stats #dataviz #plots #rstats
larmarange.github.io/ggstats/arti...
Thoughts: Very useful for quick plotting while drafting a write-up. Helper packages are good, but we can easily fall back into the cookbook method of stats.
#stats #dataviz #plots #rstats
larmarange.github.io/ggstats/arti...

February 6, 2024 at 5:50 PM
Reposted by Ronnie François

Want to learn how to use docker for reproducible data science with R / RStudio, but not sure where to start? I just re-recorded a recent workshop talk www.youtube.com/watch?v=uvbb... #rstats #statistics #psychology #docker
https://www.youtube.com/watch?v=uvbbrefeW4I
www.youtube.com
February 7, 2024 at 6:45 PM
Want to learn how to use docker for reproducible data science with R / RStudio, but not sure where to start? I just re-recorded a recent workshop talk www.youtube.com/watch?v=uvbb... #rstats #statistics #psychology #docker
Reposted by Ronnie François
New CRAN package OnomasticDiversity with initial version 0.1
#rstats
https://cran.r-project.org/package=OnomasticDiversity
#rstats
https://cran.r-project.org/package=OnomasticDiversity
CRAN - Package OnomasticDiversity
https://cran.r-project.org/package=OnomasticDiversity
cran.r-project.org
February 8, 2024 at 10:02 PM
New CRAN package OnomasticDiversity with initial version 0.1
#rstats
https://cran.r-project.org/package=OnomasticDiversity
#rstats
https://cran.r-project.org/package=OnomasticDiversity
Reposted by Ronnie François
Most of my students prefer to use their phones than to use computers, so I have made my interactive graphs more mobile-friendly. Here are some:
bit.ly/dss_mean_sd
bit.ly/dss_correlation
bit.ly/dss_linear_model
bit.ly/dss_least_squares
bit.ly/dss_random_treatment
bit.ly/dss_random_sampling
#rstats
bit.ly/dss_mean_sd
bit.ly/dss_correlation
bit.ly/dss_linear_model
bit.ly/dss_least_squares
bit.ly/dss_random_treatment
bit.ly/dss_random_sampling
#rstats
February 9, 2024 at 10:39 PM
Most of my students prefer to use their phones than to use computers, so I have made my interactive graphs more mobile-friendly. Here are some:
bit.ly/dss_mean_sd
bit.ly/dss_correlation
bit.ly/dss_linear_model
bit.ly/dss_least_squares
bit.ly/dss_random_treatment
bit.ly/dss_random_sampling
#rstats
bit.ly/dss_mean_sd
bit.ly/dss_correlation
bit.ly/dss_linear_model
bit.ly/dss_least_squares
bit.ly/dss_random_treatment
bit.ly/dss_random_sampling
#rstats