
Simon Engelhart
@sealevelchange.bsky.social
390 followers
320 following
4 posts
Department of Geography, Durham University. Interested in sea-level and climate change across all spatial/temporal scales and geologic records of past subduction zone earthquakes and extreme events https://www.durham.ac.uk/staff/simon-e-engelhart
Posts
Media
Videos
Starter Packs
Reposted by Simon Engelhart
Reposted by Simon Engelhart


Reposted by Simon Engelhart

Bob Kopp
@bobkopp.net
· 26d
Reposted by Simon Engelhart
![We are writing to raise serious concerns regarding Voortman, H. G., & De Vos, R. (2025). A Global Perspective on Local Sea Level Changes. Journal of Marine Science and Engineering.
Voortman & de Vos (2025) attempt to test for acceleration in relative sea-level (RSL) records from 243 tide gauges. They claim to have identified statistically significant acceleration in only 12 of the 243 gauges and conclude that “This pattern is inconsistent with sea level acceleration driven by global phenomena.”
This result, which stands in contrast both to other studies conducting similar tide-gauge analyses (e.g., Wang et al., 2021, 2025) and the broader body of knowledge regarding global-mean sea level change and its drivers (e.g., Fox-Kemper et al., 2021), demands scrutiny. Yet the reviewers failed to recognise the context of this manuscript and the breadth of the existing literature, resulting in at best a superficial review. Upon close examination, we believe the paper contains fatal methodological flaws that compromise the validity of its conclusions and merit retraction.
Scientific Context
Comparison to other studies of RSL acceleration at tide-gauges and IPCC projections: The conclusions of this study are dramatically different from those of Wang et al. (2021, 2025). Wang et al. (2025) concluded significant acceleration was present at 68% of tide gauges, while this paper identifies it at only 4%. It is surprising that the reviewers did not insist that the authors provide a discussion to explain how they came to such different results, rather than ignoring the substance of Wang et al. (2021) and the existence of Wang et al. (2025). (We describe some likely statistical reasons below.)
Notably, the authors state that “a comparison [of Intergovernmental Panel on Climate Change (IPCC) projections] to locally observed sea level appears to date to have been undertaken on a very limited scale”, and have made similar claims to the media, even though they cite without](https://cdn.bsky.app/img/feed_thumbnail/plain/did:plc:lwszjazwq3nliquvxg6l332b/bafkreicw4k6yw7btj7xppvnolexzhr6fxwkxmm5fminzxeufp3dlcsf5d4@jpeg)

![The authors also engage minimally with research on the global-mean sea level budget since 1900 (c.f. Fox-Kemper et al., 2021), providing a brief dismissal of one paper: “The current state of affairs is best illustrated by the paper by Frederikse et al. [(2020)] that claims to have “closed the sea level budget”. Unfortunately, a detailed inspection revealed a number of weaknesses and even errors in Frederikse’s work.” This statement is backed only by a reference to the first author’s own work (Voortman, 2023), which does not substantively engage with Frederikse et al. (2020). Regarding Frederikse et al. (2020), Voortman (2023) simply writes about his feelings: “Albeit Frederikse’s paper is an impressive scientific achievement, I feel that this conclusion is too rash. Estimating that the number of unknowns in this problem is larger than the number of equations available, I tentatively suggest that the reconstruction by Frederikse et al. is one of many plausible reconstructions that close the sea level budget.” No more “detailed inspection” of Frederikse et al. (2020) is provided in this paper or the cited source.
The authors also highlight Munk (2002)’s enigma, which was an apparent inconsistency between estimates of 20th century global-mean sea-level rise compared with constraints on changes in Earth rotation and the sea level budget, but miss subsequent work resolving it. This inconsistency was subsequently resolved by newer estimates of 20th century global-mean sea level rise, improved modeling of glacial isostatic adjustment and its effect on Earth rotation, and improved interpretation of the constraints on Earth rotation from eclipse records (e.g., Dangendorf et al., 2017; Frederikse et al., 2020; Hay et al., 2015, 2016; Mitrovica et al., 2015).](https://cdn.bsky.app/img/feed_thumbnail/plain/did:plc:lwszjazwq3nliquvxg6l332b/bafkreicufs4iuxycg2i5wji5pj7c5mx2t4ik2d7446nst3grf25omydviq@jpeg)

Reposted by Simon Engelhart
Bob Kopp
@bobkopp.net
· Sep 5
Reposted by Simon Engelhart

Adam Vaughan
@adamvaughan.bsky.social
· Jun 2

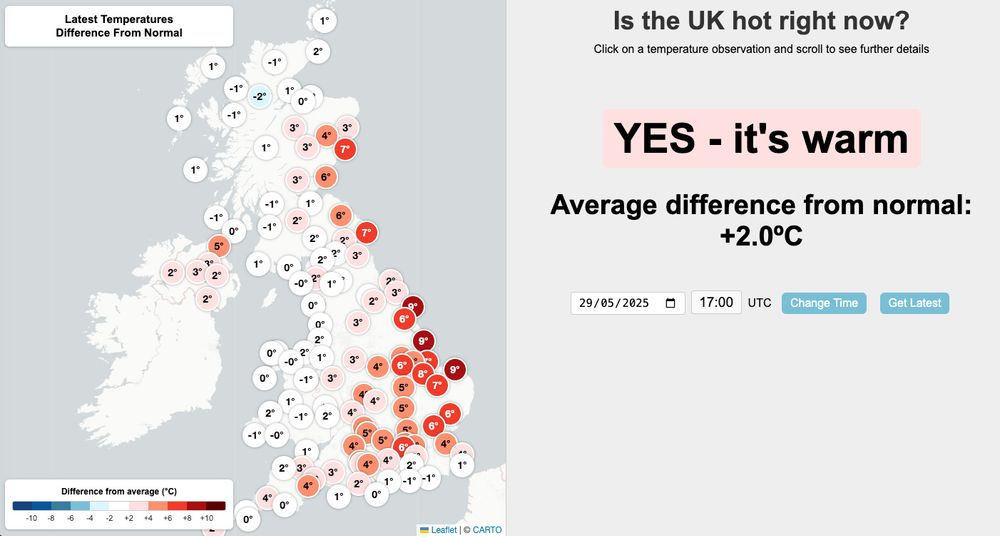
Double record breaker: Spring 2025 is warmest and sunniest on UK record
Spring 2025 has broken historical climate records, marking an unprecedented season of warmth and sunshine across the UK, according to provisional Met Office statistics.
www.metoffice.gov.uk


Reposted by Simon Engelhart

Reposted by Simon Engelhart

Reposted by Simon Engelhart
Bob Kopp
@bobkopp.net
· May 7
Reposted by Simon Engelhart

Kenneth Becker
@geophotographer.org
· May 8

A 700-year rupture sequence of great eastern Aleutian earthquakes from tsunami evidence and modeling
New research from the USGS, University of Hawaiʻi, and the University of California, Santa Cruz provides fresh insights into a prehistoric sequence of earthquakes in the Aleutian Islands. Researchers ...
www.usgs.gov
Reposted by Simon Engelhart

Reposted by Simon Engelhart


Reposted by Simon Engelhart


Reposted by Simon Engelhart
Reposted by Simon Engelhart
Reposted by Simon Engelhart


Reposted by Simon Engelhart

Reposted by Simon Engelhart


Reposted by Simon Engelhart
Reposted by Simon Engelhart