Vadim Demichev
@vadim-demichev.bsky.social
1.2K followers
1.1K following
130 posts
Group Leader at Charité – Universitätsmedizin Berlin. Proteomics technologies and applications, DIA-NN author. https://aptila.bio
Posts
Media
Videos
Starter Packs
Pinned


Reposted by Vadim Demichev


Reposted by Vadim Demichev


Reposted by Vadim Demichev


Reposted by Vadim Demichev


Reposted by Vadim Demichev

Reposted by Vadim Demichev
Mann Lab
@mannlab.bsky.social
· Aug 20

Spatial proteomics reveals mechanisms of cell-intrinsic tryptophan metabolism controlling ovarian cancer survival
Indole-2,3-dioxygenase (IDO1) depletes tryptophan to dampen anti‑tumor T cells, yet IDO1 inhibitors (IDO1i) have failed clinically. Using deep visual proteomics, we isolated IDO1 high, medium and low ...
www.biorxiv.org
Reposted by Vadim Demichev
Alison Chaves
@alisonchaves.bsky.social
· Aug 15

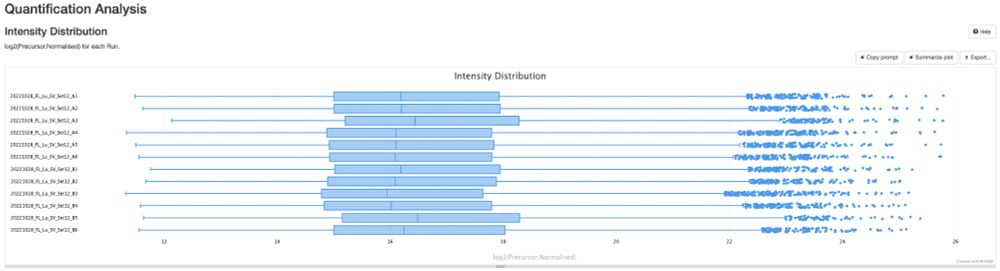
PSManalyst: A Dashboard for Visual Quality Control of FragPipe Results
FragPipe is recognized as one of the fastest computational platforms in proteomics, making it a practical solution for the rapid quality control of high-throughput sample analyses. Starting with version 23.0, FragPipe introduced the “Generate Summary Report” feature, offering .pdf reports with essential quality control metrics to address the challenge of intuitively assessing large-scale proteomics data. While traditional spreadsheet formats (e.g., tsv files) are accessible, the complexity of the data often limits user-friendly interpretation. To further enhance accessibility, PSManalyst, a Shiny-based R application, was developed to process FragPipe output files (psm.tsv, protein.tsv, and combined_protein.tsv) and provide interactive, code-free data visualization. Users can filter peptide-spectrum matches (PSMs) by quality scores, visualize protease cleavage fingerprints as heatmaps and SeqLogos, and access a range of quality control metrics and representations such as peptide length distributions, ion densities, mass errors, and wordclouds for overrepresented peptides. The tool facilitates seamless switching between PSM and protein data visualization, offering insights into protein abundance discrepancies, samplewise similarity metrics, protein coverage, and contaminants evaluation. PSManalyst leverages several R libraries (lsa, vegan, ggfortify, ggseqlogo, wordcloud2, tidyverse, ggpointdensity, and plotly) and runs on Windows, MacOS, and Linux, requiring only a local R setup and an IDE. The app is available at (https://github.com/41ison/PSManalyst.
pubs.acs.org
Reposted by Vadim Demichev

Reposted by Vadim Demichev