by Simon Carn
by Simon Carn
by Simon Carn
Reposted by: Simon Carn

by Simon Carn
by Simon Carn
Reposted by: Simon Carn

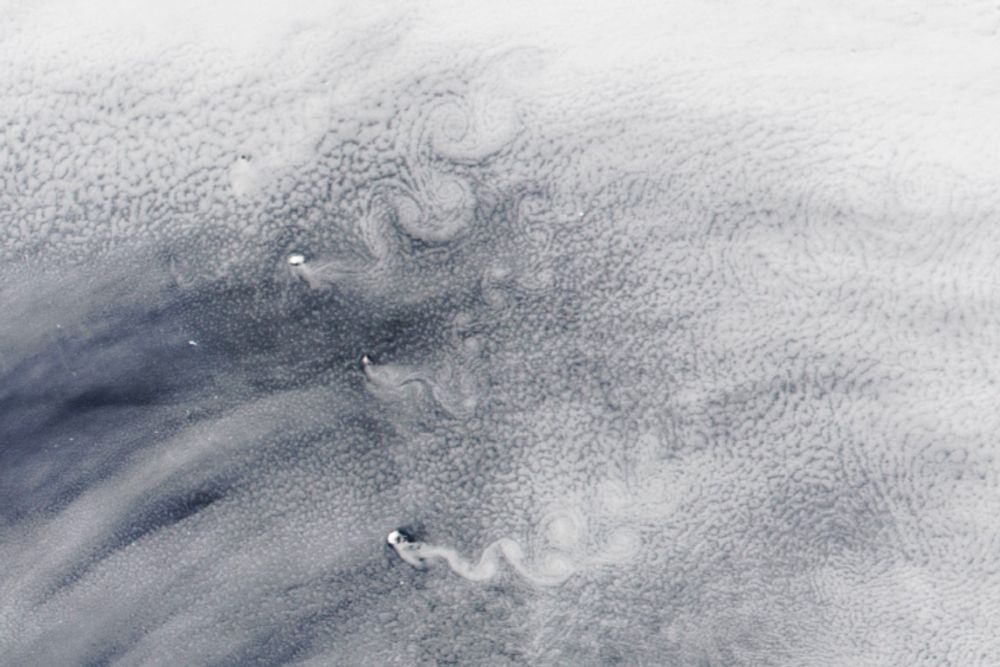
My colleague @simoncarn.bsky.social and I were consulted for this note by @avoiland.bsky.social to comment on volcanoes and clouds in the South Atlantic.
A nice place to study aerosol-cloud interactions! (and other things of course)
earthobservatory.nasa.gov/images/15404...
by Simon Carn
Reposted by: Simon Carn, Thomas Wahl, Flavio Lehner
Reposted by: Simon Carn

by Simon Carn
by Simon Carn
Reposted by: Simon Carn
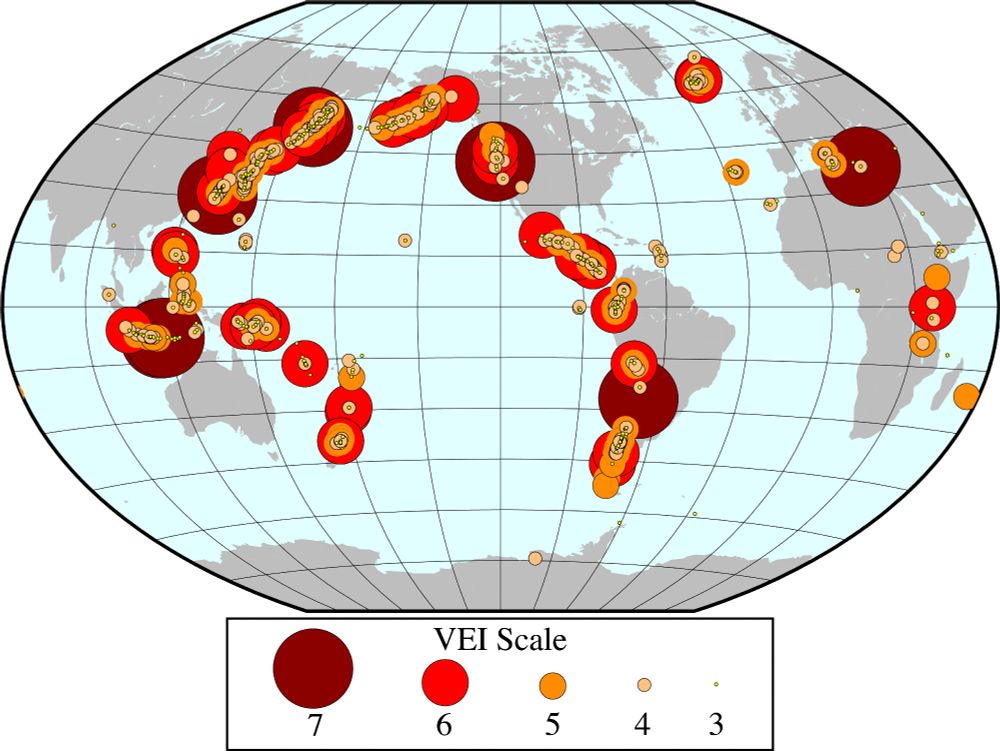
Large explosive volcanic eruptions during the Holocene plotted by VEI (Volcano Explosivity Index). Volcano data from SI Global Volcanism Program.
Reposted by: Simon Carn

In this comment led by Markus Stoffel, we argue the risk industry ought to think more seriously about 'Tambora 2.0'.
www.nature.com/articles/d41...

by Simon Carn
by Simon Carn

by Simon Carn
by Simon Carn
by Simon Carn
by Simon Carn
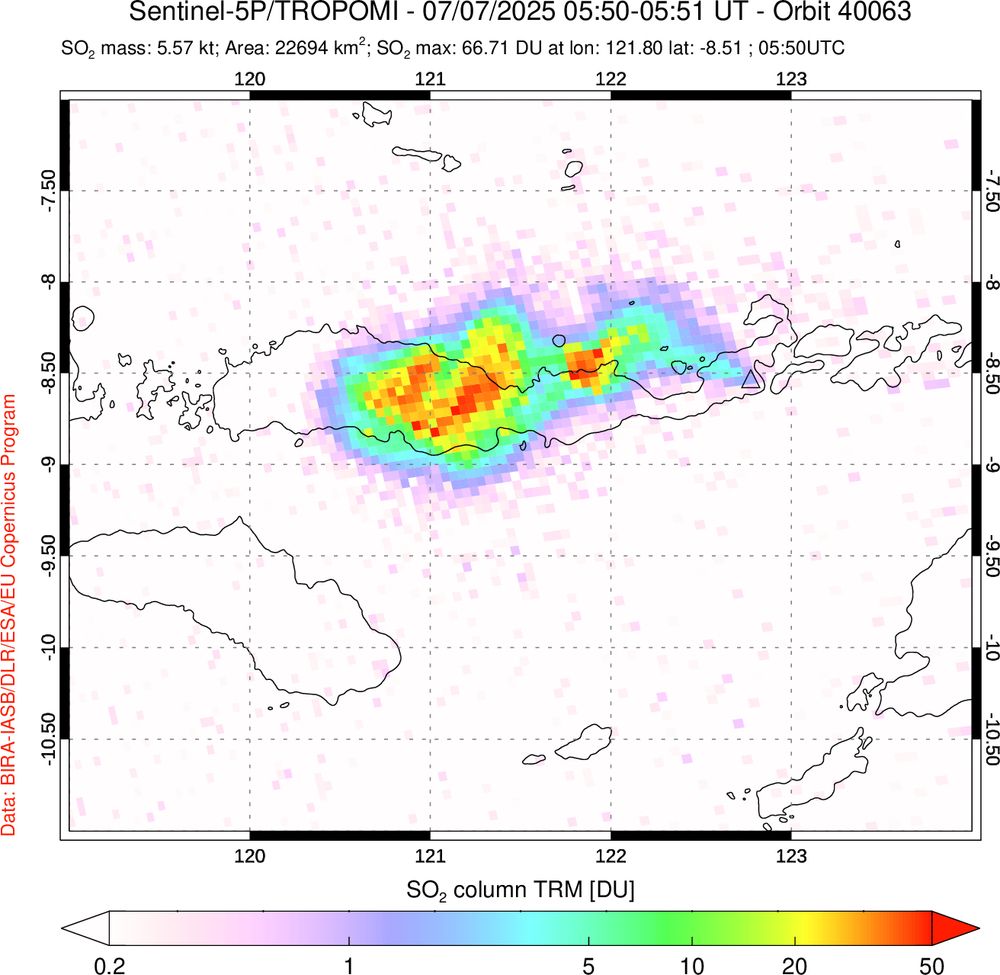
SO₂ data: @NOAA/@NASA @JPSSProgram #NOAA20-#OMPS
by Simon Carn
by Simon Carn
by Simon Carn
by Simon Carn
@phivolcs_dost @News5PH @nababaha
by Simon Carn
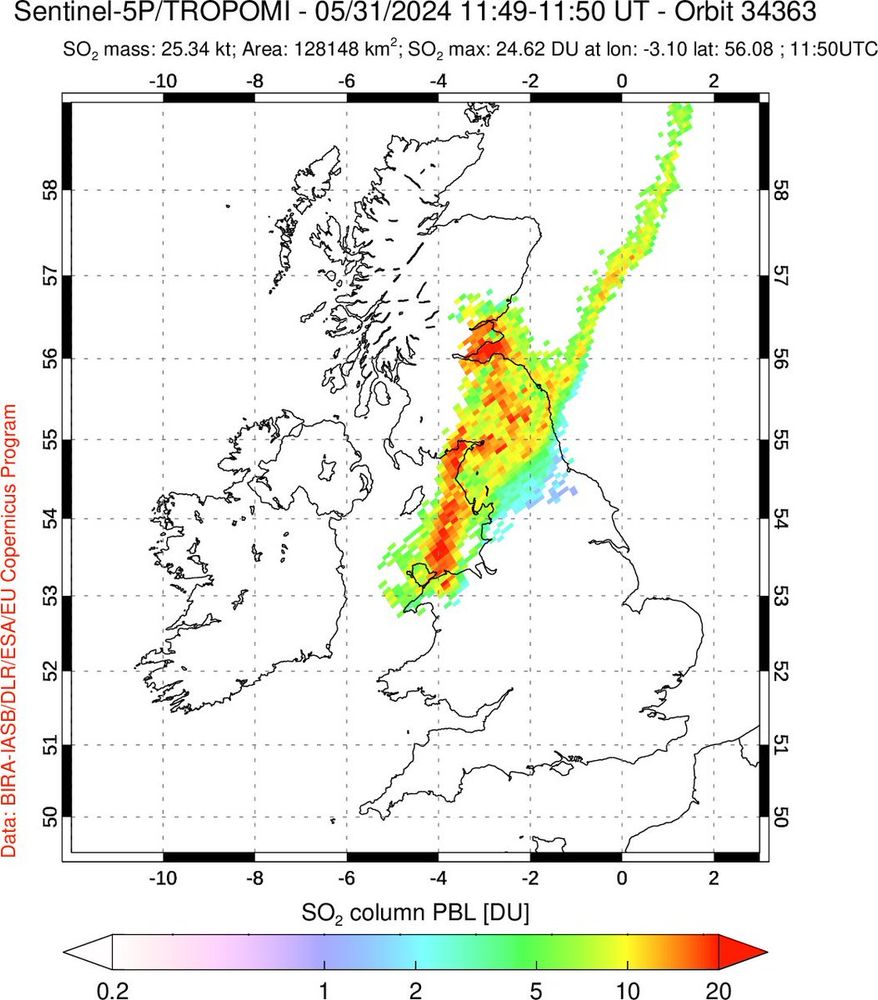
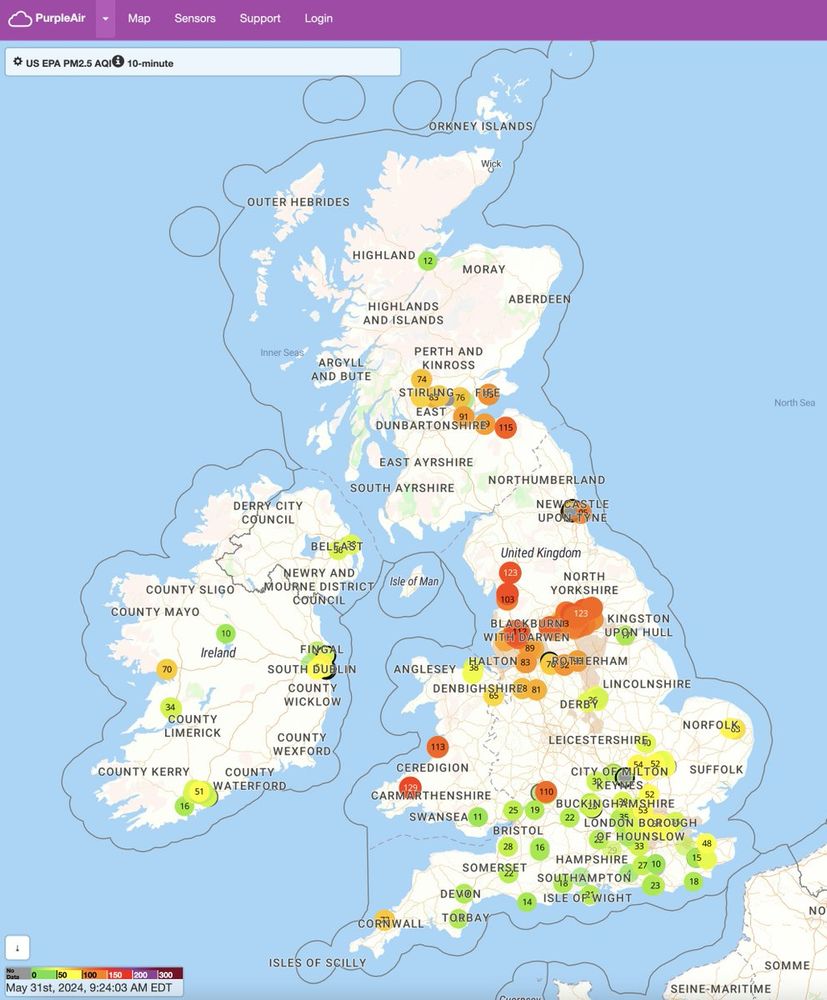
L: #TROPOMI data shows SO₂ plume at 11:50 UT
R: map shows data from the @ThePurpleAir...
by Simon Carn
by Simon Carn
by Simon Carn
by Simon Carn